By Sergey Tselovalnikov on 01 June 2016
Pure assembly in the forest of Panama
Hi!
In this article, I’ll tell you about some internal features of Project Panama. You’ll find out how to increase the performance of your Java program using a pure inline assembler.

We had two builds of jvm, seventy-five native functions, five sheets of high-powered method handles, a Panama repository full of crazy features, and a whole galaxy of native data layouts, headers, compilers, optimizations… and also a quart of heap, a case of wrappers, a pint of raw memory and two dozen AVX2 instructions. <br/> Not that we needed all that for the trip to Panama, but once you get locked into a serious jvm crash collection, the tendency is to push it as far as you can.
| ❗ | This article is written mostly about something that may never be released About API that might never be seen About code you shouldn’t use in production |
|---|
| ⚠️ | A lot of information in this article is based on my personal experiments. with the internal state of Panama forest in June 2016, so it may be deprecated when you are reading it. |
|---|
So, let’s begin our journey.
Welcome to Panama
Panama is a new project under OpenJDK that tries to improve the connection between JVM and foreign APIs, including many interfaces commonly used by C programmers. It is the missing piece in the Java ecosystem, a bridge between JAVA and native code.
The primary features that will be introduced in Project Panama are:
-
Native function calling and data access, respectfully, with huge JIT support (see JEP191) (Similar problems but without huge runtime support can be solved using JNR as explained here previous article)
-
New data layouts
-
Special tools for wrapping native libraries
The full overview of the problems that Panama tries to solve can be found here: blog post (written by John Rose). But some features in the mercurial forest of Project Panama don’t really belong to JEP 191. These features are Vector API and Machine Code Snippets.
Last December, Vladimir Ivanov, one of the core contributors of Panama project made a commit where he introduced an ability to call a snippet of machine code in runtime…
— Vladimir Ivanov (@iwan0www) December 4, 2015
This is an amazing feature, you can make an inline assembler call, crazy stuff… It’s like the new Unsafe, but even cooler! It’s like writing your own intrinsic, but in runtime. In this post I’ll be primarily focused on Machine Code Snippets. So let’s explore this opportunity.
The edge of the forest
The first program that every programmer writes in a new language is "Hello, World!". But it’s assembler, and it is called from Java. So let’s make it simple. For example, an A+B+C function looks like this in each:
Plain Java
public static int sum(int a, int b, int c) {
    return a + b + c;
}
X86 assembly
...
mov rax, rsi ; res = arg1
add rax, rdi ; res += arg2
add rax, rdx ; res += arg3
...
CodeSnippet
static final MethodHandle sum3 = jdk.internal.panama.CodeSnippet.make(
            "sum3", MethodType.methodType(int.class,/*result*/
                                          int.class /*rdi*/,
                                          int.class /*rsi*/,
                                          int.class /*rdx*/),
            true, /* isSupported */
            0x48, 0x89, 0xF0, // mov    rax,rsi
            0x48, 0x01, 0xF8, // add    rax,rdi
            0x48, 0x01, 0xD0  // add    rax,rdx
    );
Here we used jdk.internal.panama.CodeSnippet class to get MethodHandle
to native code. And yes, this package is functionally important, it
actually means internal API, so you very probably won’t be able to use
it.
As an
arguments
of MethodType#methodType you can pass primitives and some special
classes like Long2 (128 bit register), Long4 (256 bit register) and
Long8 (512 bit register).
Based on what you’ve seen above, you could say that we were able to use JNI before, so what’s the point of using inline ASM? This is true, but the thing is the C2 compiler can easily inline the code snippet. So, it gives you an opportunity (if you’re crazy enough) to write your own JVM intrinsic without coding it in the JVM.
Let’s compare assembly produced by the JVM after compiling and inlining for every method.
| Plain Java | CodeSnippet ASM | JNI |
|---|---|---|
| | |
As you can see here the only difference between the C2 JIT version and our CodeSnippet is the movement of arguments between registers to satisfy calling convention. And the C2 perfectly inlined exactly the same piece of code as shown above. At the same time, JNI performs a real native call.
But what’s the point of writing inline asm snippets in Java? Usually there is no reason to do so, the C2 is able to compile your code into something that works much faster. But there are several things that the C2 can’t do efficiently. The most important is that the C2 can’t rewrite your algorithm using SIMD operations yet.
Go deeper to hidden places
Usually our applications are not about A+B+C functions, but about some real code. And our applications can contain, say, the function that calculates checksums of buffers. A perfectly real task, that you can encounter in different kinds of software.
Let’s imagine our application has a little function called checksum that makes a sum of bytes in the buffer and gives us hash [0, 256) as a result.
Here’s the code:
private static int checksumPlainJava(ByteBuffer buffer, int size) {
    int checksum = 0;
    for (int i = 0; i < size; ++i) {
        checksum += buffer.get(i);
    }
    // make it unsigned first to avoid negative result
    return (int) (Integer.toUnsignedLong(checksum) % 256);
}
In our application we operate big byte buffers and we have to calculate checksums very often. We discovered that this checksum function is our bottleneck. And we need to optimize it. What options do we have?
JNI
You may see on the last line the ugly operation where we are trying to convert our signed int to unsigned to get the proper result. Of course, it’s the bottleneck you might think, isn’t it? The cool C++ has unsigned variables - let’s make a JNI call!
Ok, here we go, C++ code:
JNI checksum
JNIEXPORT jint JNICALL Java_me_serce_panex_ChecksumBenchmark_nativePlainChecksum
    (JNIEnv * env, jclass clz, jlong addr, jint targetLength) {
    char *target = reinterpret_cast<char *>(addr);
    unsigned int checksum = 0;
    for (int i = 0; i < targetLength; ++i) {
        checksum += (unsigned int) target[i];
    }
    return checksum % 256;
}
Now we have to check the performance. We may expect incredible results. For performance measurement we will be using JMH, the de-facto standard in Java benchmarking. You can find a great deal of articles answering the question "why JMH?" on the internet.
There is no way to get a native memory address for DirectByteBuffer, so we are using reflection trick here to get the field that contains this address. Now we’re able to access memory from C++ code directly. We’re checking how fast the function is in case of 4/8096/129536 size buffers.
Benchmark setup
private ByteBuffer buffer;
private long address = 0;

@Param({"4", "8096", "129536"})
private int size = 4;

public static long getAddress(ByteBuffer buffy) throws Throwable {
    Field address = Buffer.class.getDeclaredField("address");
    address.setAccessible(true);
    return address.getLong(buffy);
}

@Setup
public void setup() throws Throwable {
    buffer = ByteBuffer.allocateDirect(size).order(ByteOrder.nativeOrder());
    ThreadLocalRandom random = ThreadLocalRandom.current();
    for (int i = 0; i < size / 4; i++) {
        buffer.putInt(random.nextInt());
    }
    address = getAddress(buffer);
}
And the results
Benchmark                       (size)  Mode  Cnt   Score    Error  Units
ChecksumBenchmark.JNI_Checksum       4  avgt    3   0.009 ±  0.001  us/op
ChecksumBenchmark.JNI_Checksum    8096  avgt    3   3.085 ±  0.039  us/op
ChecksumBenchmark.JNI_Checksum  129536  avgt    3  48.879 ±  5.655  us/op
ChecksumBenchmark.plainJava          4  avgt    3   0.006 ±  0.001  us/op
ChecksumBenchmark.plainJava       8096  avgt    3   2.190 ±  0.834  us/op
ChecksumBenchmark.plainJava     129536  avgt    3  34.452 ±  3.341  us/op
As you can see, the JNI loop is slower. But what happened? Could it mean that JNI is really slow? As we saw earlier CodeSnippet is faster. So we can try the same with code, but written using CodeSnippet!
However, it may be hard to write code in pure machine codes, so we can make it another way. We can write C++ code; then compile it, open it in a hex editor and put the machine code into our method. Sounds creepy, but it’s possible.
Several things you should be careful about:
-
You shouldn’t have a ret instruction, JVM will take care of it.
-
You should look carefully through your assembly code to be sure that it doesn’t try to access outside memory using an outside method.
-
And, finally, you should be careful about calling convention
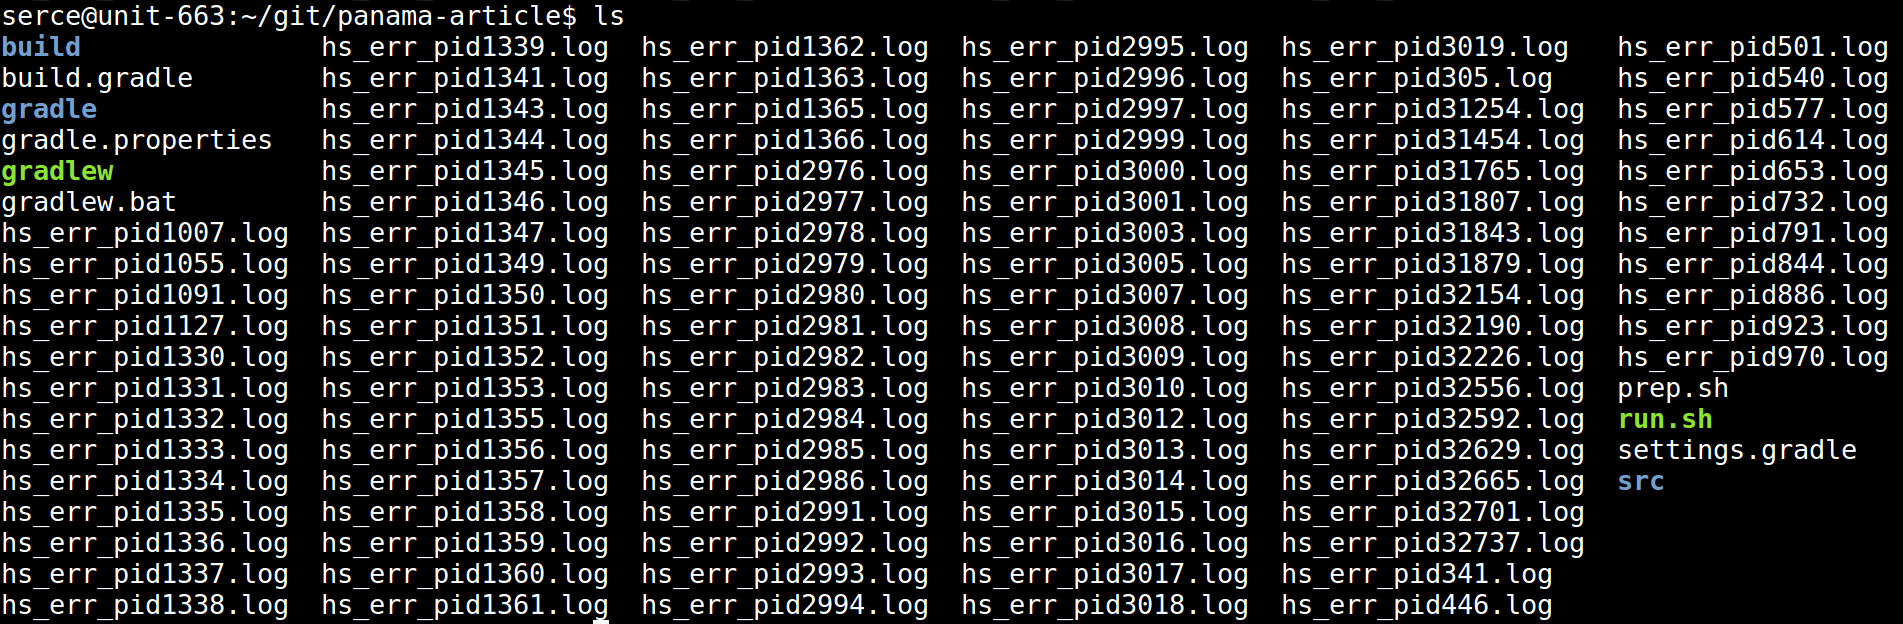
Typical ls picture that you can see get after several experiments
Here’s the code and we’re ready to run benchmark again
static final MethodHandle codeSnippetChecksum = jdk.internal.panama.CodeSnippet.make(
        "checksum", MethodType.methodType(int.class, long.class, int.class),
        isX64(),
        0x48, 0x85, 0xF6, 0x74, 0x1E, 0x48, 0x01, 0xFE, 0x31, 0xC0, 0x66, 0x0F, 0x1F, 0x44,
        0x00, 0x00, 0x0F, 0xBE, 0x17, 0x48, 0x83, 0xC7, 0x01, 0x01, 0xD0, 0x48, 0x39, 0xF7,
        0x75, 0xF2, 0x0F, 0xB6, 0xC0, 0xEB, 0x02, 0x31, 0xC0);

@Benchmark
public int codeSnippetChecksum() throws Throwable {
    return (int) plainC_O2.invoke(address, size);
}
Result
Benchmark                              (size)  Mode  Cnt   Score    Error  Units
ChecksumBenchmark.JNI_Checksum              4  avgt    4   0.008 ±  0.001  us/op
ChecksumBenchmark.JNI_Checksum           8096  avgt    4   3.060 ±  0.056  us/op
ChecksumBenchmark.JNI_Checksum         129536  avgt    4  49.865 ±  2.135  us/op
ChecksumBenchmark.codeSnippetChecksum       4  avgt    4   0.005 ±  0.001  us/op
ChecksumBenchmark.codeSnippetChecksum    8096  avgt    4   2.806 ±  0.243  us/op
ChecksumBenchmark.codeSnippetChecksum  129536  avgt    4  48.911 ±  0.448  us/op
ChecksumBenchmark.plainJava                 4  avgt    4   0.006 ±  0.001  us/op
ChecksumBenchmark.plainJava              8096  avgt    4   2.163 ±  0.035  us/op
ChecksumBenchmark.plainJava            129536  avgt    4  34.414 ±  0.984  us/op
And finally, you can observe pretty much the same results. The only noticeable difference is for buffers that have a very small size. And even the CodeSnippet version is slower than the code produced by JIT.
The key is I used -O2 GCC option, which doesn’t perform a lot of interesting optimizations.
g++ -shared -fpic -Wall -O2 -I/usr/include ... checksum.c -o libchecksum.so
And as a result, GCC didn’t perform well, and we’ve got an almost literal translation of that we wrote in C++ to assembly. At the same time, JIT gave us a good unrolled loop.
| JIT | GCC O2 |
|---|---|
| |
So, we can use -O3 if we need more optimizations.
With -03
Benchmark                                (size)  Mode  Cnt   Score    Error  Units
ChecksumBenchmark.JNI_Checksum                4  avgt    4   0.009 ±  0.001  us/op
ChecksumBenchmark.JNI_Checksum             8096  avgt    4   3.089 ±  0.066  us/op
ChecksumBenchmark.JNI_Checksum           129536  avgt    4  49.481 ±  2.071  us/op
ChecksumBenchmark.codeSnippetChecksum         4  avgt    4   0.005 ±  0.001  us/op
ChecksumBenchmark.codeSnippetChecksum      8096  avgt    4   2.784 ±  0.153  us/op
ChecksumBenchmark.codeSnippetChecksum    129536  avgt    4  49.350 ±  2.208  us/op
ChecksumBenchmark.codeSnippetChecksumO3       4  avgt    4   0.006 ±  0.001  us/op
ChecksumBenchmark.codeSnippetChecksumO3    8096  avgt    4   0.621 ±  0.022  us/op
ChecksumBenchmark.codeSnippetChecksumO3  129536  avgt    4   9.672 ±  0.201  us/op
ChecksumBenchmark.plainJava                   4  avgt    4   0.006 ±  0.001  us/op
ChecksumBenchmark.plainJava                8096  avgt    4   2.161 ±  0.089  us/op
ChecksumBenchmark.plainJava              129536  avgt    4  34.825 ±  1.178  us/op
There is a simple explanation why GCC -03 version is faster than code emitted by JIT. Here GCC was able to vectorize our loop. So, it used SIMD instructions which gave our processor an ability to "parallelize" execution.
| JIT | GCC O3 |
|---|---|
| |
But what if we need more performance? Can we do it better than GCC?
SIMD
It is possible to write the same code, but using AVX2 (256 byte registers) instructions. (Thanks, @kellylittlepage, for an awesome article where I’ve read how to do it).
C++ function that will be compiled and putted in CodeSnippet
int avxChecksumAVX2(const char *const target, size_t targetLength) {
    const __m256i zeroVec = _mm256_setzero_si256();
    short d[16] = {1, 1, 1, 1, 1, 1, 1, 1,
                   1, 1, 1, 1, 1, 1, 1, 1};
    const __m256i oneVec = *((__m256i *) d);
    __m256i accum = _mm256_setzero_si256();
    unsigned int checksum = 0;
    size_t offset = 0;

    if (targetLength >= 32) {
        for (; offset <= targetLength - 32; offset += 32) {
            __m256i vec = _mm256_loadu_si256(
                    reinterpret_cast<const __m256i *>(target + offset));
            __m256i vl = _mm256_unpacklo_epi8(vec, zeroVec);
            __m256i vh = _mm256_unpackhi_epi8(vec, zeroVec);

            accum = _mm256_add_epi32(accum, _mm256_madd_epi16(vl, oneVec));
            accum = _mm256_add_epi32(accum, _mm256_madd_epi16(vh, oneVec));
        }
    }

    for (; offset < targetLength; ++offset) {
        checksum += (int) target[offset];
    }

    accum = _mm256_add_epi32(accum, _mm256_srli_si256(accum, 4));
    accum = _mm256_add_epi32(accum, _mm256_srli_si256(accum, 8));
    return (_mm256_extract_epi32(accum, 0) + _mm256_extract_epi32(accum, 4) +
            checksum) % 256;
}
This is how a simple checksum function looks like after rewriting for vectorizing execution. Here, some GCC intrinsics like _mm256_unpacklo_epi8 and _mm256_add_epi32 are used. GCC has a special implementation for this functions that uses AVX2 instructions. Almost always it is just one instruction.
Here you can find a full guide of Intel intrinsics
This functions isn’t so easy to understand, but how fast is it?
Result
ChecksumBenchmark.JNI_Checksum                4  avgt    4   0.008 ±  0.001  us/op
ChecksumBenchmark.JNI_Checksum             8096  avgt    4   3.128 ±  0.024  us/op
ChecksumBenchmark.JNI_Checksum           129536  avgt    4  49.629 ±  0.694  us/op
ChecksumBenchmark.avx2Impl                    4  avgt    4   0.014 ±  0.001  us/op
ChecksumBenchmark.avx2Impl                 8096  avgt    4   0.239 ±  0.018  us/op
ChecksumBenchmark.avx2Impl               129536  avgt    4   4.128 ±  0.052  us/op
ChecksumBenchmark.codeSnippetChecksum         4  avgt    4   0.005 ±  0.001  us/op
ChecksumBenchmark.codeSnippetChecksum      8096  avgt    4   2.795 ±  0.044  us/op
ChecksumBenchmark.codeSnippetChecksum    129536  avgt    4  49.656 ±  0.733  us/op
ChecksumBenchmark.codeSnippetChecksumO3       4  avgt    4   0.006 ±  0.001  us/op
ChecksumBenchmark.codeSnippetChecksumO3    8096  avgt    4   0.630 ±  0.004  us/op
ChecksumBenchmark.codeSnippetChecksumO3  129536  avgt    4   9.810 ±  0.100  us/op
ChecksumBenchmark.plainJava                   4  avgt    4   0.006 ±  0.001  us/op
ChecksumBenchmark.plainJava                8096  avgt    4   2.224 ±  0.122  us/op
ChecksumBenchmark.plainJava              129536  avgt    4  35.042 ±  0.252  us/op
Awesome it is 8x times faster than our original code.
Java way
Let’s say, now we met our performance requirements, but can we make it more readable than just an ugly blob of ASM code produced by GCC? It is possible to save the main loop inside Java and use Long4 vectors to pass data.
Java version of that scary function
public class VectorIntrinsics {
    ...
    private static final MethodHandle _mm256_loadu_si256 = jdk.internal.panama.CodeSnippet.make(
            "_mm256_loadu_si256", MethodType.methodType(Long4.class, long.class),
            true,
            0xC5, 0xFE, 0x6F, 0x06 // vmovdqu ymm0, YMMWORD PTR [rdi]
    );
    public static Long4 _mm256_loadu_si256(long address) throws Throwable {
        return (Long4) _mm256_loadu_si256.invoke(address);
    }
    ...
}

private static int JAVA_avxChecksumAVX2(ByteBuffer buffer, long target, int targetLength)
    throws Throwable {
        Long4 zeroVec = Long4.ZERO;
        Long4 oneVec = ones;
        Long4 accum = Long4.ZERO;
        int checksum = 0;
        int offset = 0;

        if (targetLength >= 32) {
            for (; offset <= targetLength - 32; offset += 32) {
                Long4 vec = _mm256_loadu_si256(target + offset);
                Long4 vl = _mm256_unpacklo_epi8(vec, zeroVec);
                Long4 vh = _mm256_unpackhi_epi8(vec, zeroVec);

                accum = _mm256_add_epi32(accum, _mm256_madd_epi16(vl, oneVec));
                accum = _mm256_add_epi32(accum, _mm256_madd_epi16(vh, oneVec));
            }
        }

        for (; offset < targetLength; ++offset) {
            checksum += (int) buffer.get(offset);
        }

        accum = _mm256_add_epi32(accum, _mm256_srli_si256_4(accum));
        accum = _mm256_add_epi32(accum, _mm256_srli_si256_8(accum));
        long finalChecksum = _mm256_extract_epi32_0(accum) + _mm256_extract_epi32_4(accum)
                        + checksum;
        return (int) (Integer.toUnsignedLong((int) finalChecksum) % 256);
    }
Now it is written in the right way. We wrote a lot of small methods; every method represents one small AVX2 instruction. And the main loop is written in Java. This code is reusable; it is much easier to write and understand than trying to write one big ASM blob. But, a big surprise, it is much slower than the ugly ASM blob.
And again, JMH will help us to find answer with gc profiler.
That’s why
JAVA_avx2Impl                                129536  avgt    4      30.394 ±     6.813   us/op
JAVA_avx2Impl:·gc.alloc.rate                 129536  avgt    4         NaN              MB/sec
JAVA_avx2Impl:·gc.count                      129536  avgt    4      34.000              counts
JAVA_avx2Impl:·gc.time                       129536  avgt    4      39.000                  ms
avx2Impl                                     129536  avgt    4       4.192 ±     0.246   us/op
avx2Impl:·gc.alloc.rate                      129536  avgt    4         NaN              MB/sec
avx2Impl:·gc.count                           129536  avgt    4         ≈ 0              counts
JAVA_avxChecksumAVX2 produces high allocation rate. Despite the fact
that vector types work with escape analysis really well, this loop
breaks our hopes. Because Long4 is immutable, we have to save accum to
the same variable on every loop iteration. Escape analysis can’t
understand this and we are getting a lot of allocations of boxed vector
values.
Problematic code for Escape Analysis
Long accum = Long4.ZERO;
for (; offset <= targetLength - 32; offset += 32) {
    Long4 vec = _mm256_loadu_si256(target + offset);
    accum = operation(accum, vec); // EA, you are drunk, go home
}
This problem is known issue. Very probably it will be fixed soon, but how can it be solved now?
As a workaround, we may try to create a temporary buffer and use a pair
of _mm256_loadu_si256 and _mm256_storeu_si256 instructions on every
iteration. That intrinsics use vmovdqu instruction to load/store
register value to the memory.
GC free solution
static final ByteBuffer tmpBuf = ...
...
for (; offset <= targetLength - 32; offset += 32) {
    Long4 vec = _mm256_loadu_si256(target + offset);
    Long4 accum = _mm256_loadu_si256(tmpBuffAddr);
    Long4 result = operation(accum, vec);
    _mm256_storeu_si256(tmpBuffAddr, result);
}
Results
Benchmark                                       (size)  Mode  Cnt   Score   Error   Units
ChecksumBenchmark.JAVA_avx2Impl                 129536  avgt    4  23.837 ± 0.064   us/op
ChecksumBenchmark.JAVA_avx2Impl:·gc.alloc.rate  129536  avgt    4     NaN          MB/sec
ChecksumBenchmark.JAVA_avx2Impl:·gc.count       129536  avgt    4     ≈ 0          counts
Now function is GC free; there is no garbage anymore and it is faster, but actually it’s still quite slow. To understand why we should use a profiler, but simple solutions like Yourkit or JProfiler won’t help us, we must work on instruction level. Thank goodness, JMH has an excellent support of perf profiler, you need just to pass an option to it (don’t forget to install perf on your system before).
 12.39%   26.58%    vmovdqu YMMWORD PTR [rsp+0x40],ymm0
 12.88%    2.85%    movabs r10,0x6d61010e8
           0.01%    vmovdqu ymm1,YMMWORD PTR [r10+0x10]
  0.01%             vmovdqu ymm0,YMMWORD PTR [rsp+0x20]
                    vpunpcklbw ymm0,ymm0,ymm1
  4.42%    0.03%    movabs r10,0x6d61010b8
  0.01%             vmovdqu ymm1,YMMWORD PTR [r10+0x10]
  0.02%    0.01%    vpmaddwd ymm0,ymm0,ymm1
  0.02%    0.01%    vpmaddwd ymm0,ymm0,ymm1
           0.02%    vmovdqu ymm1,ymm0
  4.20%    2.95%    vmovdqu ymm0,YMMWORD PTR [rsp+0x40]
  8.45%   22.88%    vpaddd ymm0,ymm1,ymm0
 12.91%    5.79%    vmovdqu YMMWORD PTR [rsp+0x40],ymm0
As you can see, we are spending an enormous amount of time just to load
out the temporary buffer and store it back just to avoid GC. So, we can
rewrite algorithm a little bit instead. We’ll be saving a final result
to checksum variable right in the loop instead of using it further in
vector calculations.
Here the code
for (; offset <= targetLength - 32; offset += 32) {
    Long4 vec = _mm256_loadu_si256(target + offset);
    Long4 lVec = _mm256_unpacklo_epi8(vec, zeroVec);
    Long4 hVec = _mm256_unpackhi_epi8(vec, zeroVec);
    Long4 sum = _mm256_add_epi16(lVec, hVec);
    sum = _mm256_hadd_epi16(sum, sum);
    sum = _mm256_hadd_epi16(sum, sum);
    sum = _mm256_hadd_epi16(sum, sum);
    checksum += _mm256_extract_epi16_0(sum) + _mm256_extract_epi16_15(sum);
}
Benchmark results
Benchmark                        (size)  Mode  Cnt   Score    Error  Units
ChecksumBenchmark.JAVA_avx2Impl       4  avgt    4   0.005 ±  0.001  us/op
ChecksumBenchmark.JAVA_avx2Impl    8096  avgt    4   1.245 ±  0.028  us/op
ChecksumBenchmark.JAVA_avx2Impl  129536  avgt    4  20.095 ±  0.314  us/op
ChecksumBenchmark.avx2Impl            4  avgt    4   0.013 ±  0.001  us/op
ChecksumBenchmark.avx2Impl         8096  avgt    4   0.211 ±  0.004  us/op
ChecksumBenchmark.avx2Impl       129536  avgt    4   3.317 ±  0.077  us/op
ChecksumBenchmark.plainJava           4  avgt    4   0.005 ±  0.001  us/op
ChecksumBenchmark.plainJava        8096  avgt    4   2.109 ±  0.035  us/op
ChecksumBenchmark.plainJava      129536  avgt    4  33.503 ±  0.227  us/op
This version of the code is even faster, but it can’t achieve the performance of big ugly assembly blob yet because escape analysis is like a big stone on our way. However this code can be maintained easily, and this API is under active development; there are a lot of experiments happening right now. So, you will have fought this ugly blob when these features are released.
Moreover, all that machine snippets and direct Long* vector parameters are really low-level API. Prototypes of high-level API you can find here and here.
I think that’s a perfect point to end a journey through the jungle of Panama. We have seen enough crazy things. I’ll be glad to hear any comments from you. You can find all the experiments here (don’t forget to build your own JDK before running the benchmarks). I’ll be glad to hear any comments from you.
Conclusions
- Project Panama will bring us great features, but these are likely to arrive much further down the line
- Nothing is impossible, even running an inline assembler from Java
- There are a lot of features that can be done in Java with Vector API and Machine Code Snippets already, although it is only the beginning of the story.
- Compiler can optimize your code really well, most probably better than you.
- It is very important to measure performance while you are doing optimizations. Or else you can make it even worse.
- Seeing how your code will work in the future will help you to better understand how it works now.
Thanks to
- @kellylittlepage for an awesome article about AVX instruction
- @harrigan_shane for comments about my writing style
- @iwan0www for comments and suggestions regarding this post
- You for reading it
Discuss on
Subscribe
I'll be sending an email every time I publish a new post.
Or, subscribe with RSS.