By Sergey Tselovalnikov on 01 February 2023
JVM Field Guide: Memory
A field guide is a book designed to help identify birds, spiders, or other animals while on a nature walk. Typically, these books are very concise as you don’t want to bring a five volume encyclopaedia to your bushwalk. They only contain the necessary details while leaving out less important information.
This article is the first chapter of an attempt to create such a guide for running and supporting JVM applications. A guide that is concise only contains the necessary information, and can be used to find a solution when encountering a problem in the field. As with animal kingdoms, there are five fundamental resources that can affect JVMs runtime: Memory, CPU, Disk IO, Network, and thread synchronisation.
This article focuses on the first one – memory. Memory is an extensive topic. There could be books written on how JVM applications use memory, and it’s impossible for a single article to cover the whole story. Instead, the guide focuses on the most practical aspects of dealing with JVM applications, primarily server-side ones, and provides plenty of references for those who’d like to dive deeper.

I think I’m gonna go stare at a wall for a while and rethink everything.
Setup
The best way to learn is by doing. Each section of the guide includes examples you can run yourself to learn to recognise and resolve issues. You can download all of the examples from Github.
The test environment choice for this article is an ubuntu docker image that’s sized to use 2GB of memory. The choice tries to mimic one of the typical server-side applications one can encounter in the wild. Yet, most of the learnings from this article can be translated into other environments.
To start the journey, and prepare all necessary files, type these lines in your terminal.
$ git clone [email protected]:SerCeMan/jvmfieldguide-mem.git
$ cd jvmfieldguide-mem
$ ./run.sh build # build the docker image
$ ./run.sh run bash # runs a bash session within the built image
Process Memory Usage
Like any other application, a java process allocates memory. Before diving into the JVM-specific details, it’s helpful to understand how various Linux tools without any jvm awareness can give insights into memory usage.
Let’s use a simple Java program below as a guinea pig -
LongRunningAlloc. The program allocates 150 1M byte arrays, then drops 25 of
them, then allocates more until the number reaches 150 again, and
repeats the cycle. The below snippet describes pretty much the whole
program. By no means it represents a real workload, but it allocates
memory, allows for it to be released, and produces a lot of garbage to
collect, which is precisely what we need for various tests, so we’ll be
using this example throughout the article.
var blocks = new ArrayDeque<byte[]>();
while (true) {
    blocks.add(new byte[1024 * 1024]);
    Thread.sleep(1);
    if (blocks.size() > 150) {
        for (int i = 0; i < 25; i++) {
            blocks.pop();
        }
    }
}
Let’s start the java process and launch top to understand how much memory the program uses according to the operating system.
$ # run inside the container bash session we've opened with run.sh above
$ java -cp build/classes/java/main/ me.serce.LongRunningAlloc &
$ top

  PID USER      PR  NI    VIRT    RES    SHR S  %CPU  %MEM     TIME+ COMMAND
 7390 root      20   0 3801200 459712  26920 S  24.3   7.6   0:02.01 java
    1 root      20   0    7364   3696   3440 S   0.0   0.1   0:00.38 bash
   13 root      20   0    7244   3496   3316 S   0.0   0.1   0:00.21 bash
 7417 root      20   0    9072   3576   3088 R   0.0   0.1   0:00.00 top
We can see that top shows not single but multiple columns related to memory usage. Most of the observability tools would report memory usage as Resident Set Size (RSS, or RES) - the memory that’s held in RAM, Virtual Memory Size (VIRT, or VSZ) - the total amount of virtual memory used by the task, and Shared Memory Size (SHR) — the amount of memory potentially shared with other processes.
VIRT indicates that the process uses 4G of memory which might sound suspicious given only 2G is allocated to the container. The suspicion is correct in that virtual memory doesn’t need to resize in RAM to be allocated. Only when the memory page starts being used does it need to reserve the space in RAM. A simple mental model you can use to understand the difference is to think of VIRT as the memory that the process has requested from the OS, while RSS is the memory that the process actually used.
The concept can be demonstrated by this timeless C example that tries to answer the question of how much memory a single program can allocate. Looking at the difference between the two programs below can help to solidify a mental model around the concept.
| Allocate | Allocate & Use |
|---|---|
|
|
The program on the left can run for much longer than the second. But
both get killed by Linux Out Of Memory (OOM) killer after running for
some time when the OS notices that there is almost no free memory left.
You can run the programs yourself and compare the output of top.
$ cd src/main/c
$ # change 1 to 2 below to run the code on the right
$ gcc allocvirt1.c -o allocvirt1 && ./allocvirt1 &
$ top
When running the program on the left, we can observe the process running for a while, allocating half a terabyte of virtual memory while keeping the resident set size at bay. At the same time, the program on the right uses the allocated memory, and the Linux OOM killer terminates it almost immediately, only after only two seconds of running.
Running $ dmesg | tail -n 10 shows the last 10 kernel messages,
including the killed process info. When comparing the OOM killer
"postmortems" for both runs, we can see a drastic difference in the size
of virtual memory and the size used for page tables — the mapping
between virtual addresses and physical addresses.
| Allocate | Allocate & Use |
|---|---|
|
|
Most application monitoring tools will have RSS included in the metrics, and it’s critical to ensure the running application isn’t crossing the threshold, or otherwise, the process might suddenly die. Notably, the docker limits do not only include RSS but also page cache, so it’s important to ensure that monitoring tools include this as well. Notably, reported RSS can’t be trusted in absolutely all cases, which we will see when we discuss garbage collection.
Memory regions
With this knowledge, we can now switch back to Java land and understand
how JVM uses memory. The vital difference between the C examples we
looked at above and a Java program is that JVM is a runtime. JVM manages
memory for you, meaning that there is no need for a developer ever to
call free directly to release memory. Garbage Collection (GC) takes
care of the allocated memory and releases the memory occupied by objects
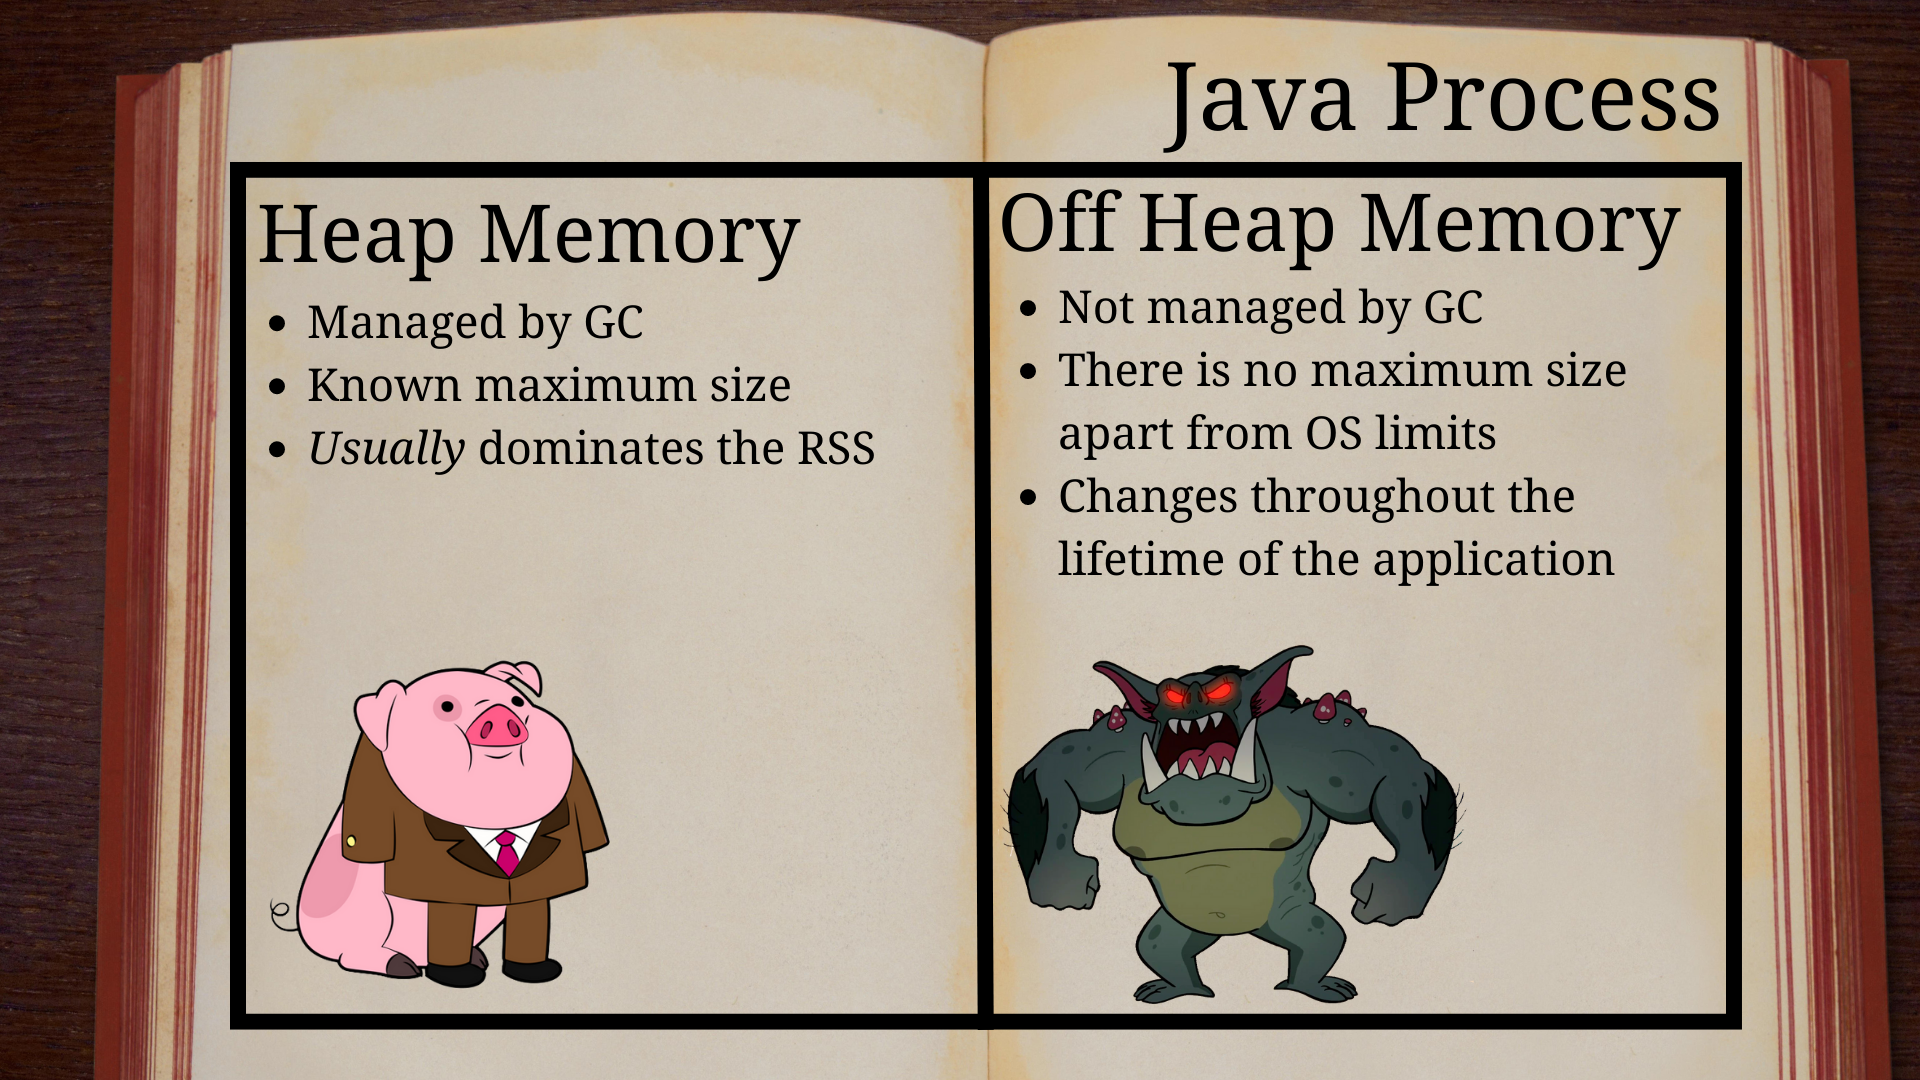
not referenced by the application anymore. The memory used by JVM
consists of heap memory managed by GC, and off-heap memory, not
controlled by GC.
However, the GC existence can’t prevent a JVM process from running out of heap memory; otherwise, this article wouldn’t exist. Here’s an example of a Java program with an evident memory leak.
public class OomAlloc {
    public static void main(String[] args) {
        var blocks = new ArrayList<byte[]>();
        try {
            while (true) {
                for (int i = 0; i < 1024; i++) {
                    blocks.add(new byte[1024]);
                }
                Thread.sleep(1);
            }
        } catch (Throwable e) {
            int size = blocks.size();
            blocks = null;
            System.out.println("Final size: " + (size / 1024) +
                    " mb, and " + (size % 1024) + " kb");
            e.printStackTrace();
        }
    }
}
What happens when the JVM runs out of memory? If you ask a java
engineer, a common answer would be that OutOfMemoryError gets thrown.
However, that’s not quite correct as it’s a trick question, and the
right answer would be to clarify what whoever asks the question means
when they say "out of memory". Let’s run the example above inside the
container to observe the effects, and how the answer to the question
changes depending on the environment.
$ java -cp build/classes/java/main/ me.serce.OomAlloc
Final size: 510 mb, and 807 kb
java.lang.OutOfMemoryError: Java heap space
        at me.serce.OomAlloc.main(OomAlloc.java:11)
The application expectedly failed with OutOfMemoryError. When one sees
such an error, the first instinct is often to increase the heap size.
Evidently, 511M is much smaller than the 2G allocated to the container.
Let’s try the approach and give the process the same 2G of memory as
we’ve given to the container.
$ java -Xmx2G -cp build/classes/java/main/ me.serce.OomAlloc
Killed
$ dmesg | tail -n 2
[207294.397405] Out of memory: Killed process 77658 (java) total-vm:5765800kB, anon-rss:2036384kB, file-rss:0kB, shmem-rss:0kB, UID:0 pgtables:4424kB oom_score_adj:0
[207294.612909] oom_reaper: reaped process 77658 (java), now anon-rss:0kB, file-rss:0kB, shmem-rss:0kB
Here, out-of-memory looks very different. JVM was told it could use 2G of heap memory, but beyond the heap space that’s given to the application code, the JVM also need to store various internal structures. But only 2G of total memory was available, so once the process started dangerously getting close to the limit, the OOM killer killed it. Finding that sweet spot that gives the application enough memory and doesn’t cause crashes along the way can be an interesting endeavour.
Yet, crashes and errors are not the only two options. Some applications can simply freeze, while the CPU usage shoots through the roof as the application enters the infamous GC death spiral in which the application desperately tries to free memory without much success.
Above, we saw three flavours of out-of-memory that can happen to JVM applications. One is a gentle exception thrown when a java program runs out of memory within the heap. The second one is OOM killer terminating the process. And the third one is the GC death spiral.
And one more thing might need explaining. It might be unclear why the application was only able to allocate ~511M of memory in the first run. The amount of allocated data is due to the heap size being restricted to 512M.
$ java  -XX:+PrintFlagsFinal -version | egrep ' MaxHeapSize | MaxRAMPercentage '
   size_t MaxHeapSize                              = 536870912                                 {product} {ergonomic}
   double MaxRAMPercentage                         = 25.000000                                 {product} {default}
The size matches the 25% of all available memory defined by MaxRAMPercentage. In many cases, the value can be too conservative and wasteful, especially at scale. You might want to increase it for more optimal memory utilisation. However, going too far can result in your process being killed; as with everything else, it’s a balancing act.
When setting the heap size, it’s also worthwhile keeping compressed references in mind, as JVM can optimise pointer size better for smaller heap sizes. Let’s now dive into heap memory to understand how it can be used most efficiently.
Heap memory
Exploring the heap is easier when the application runs for a while and
doesn’t immediately die with an out-of-memory error. The previous
LongRunningAlloc example did precisely this, so we’ll use it in the
next section.
The maximum heap size can be specified with the Xmx (MaxHeapSize) option. JVM heap memory usage is reported in JMX metrics and can be observed through a variety of observability tools. Let’s start a long-running JVM that produces some garbage and use Java Mission Control to monitor the heap size.
$ JMX_OPTS=(
    "-Dcom.sun.management.jmxremote"
    "-Dcom.sun.management.jmxremote.local.only=false"
    "-Dcom.sun.management.jmxremote.port=9898"
    "-Dcom.sun.management.jmxremote.host=0.0.0.0"
    "-Dcom.sun.management.jmxremote.rmi.port=9898"
    "-Dcom.sun.management.jmxremote.authenticate=false"
    "-Dcom.sun.management.jmxremote.ssl=false"
    "-Djava.rmi.server.hostname=0.0.0.0"
  )
$ java -Xmx1G ${JMX_OPTS[@]} -cp build/classes/java/main/ me.serce.LongRunningAlloc
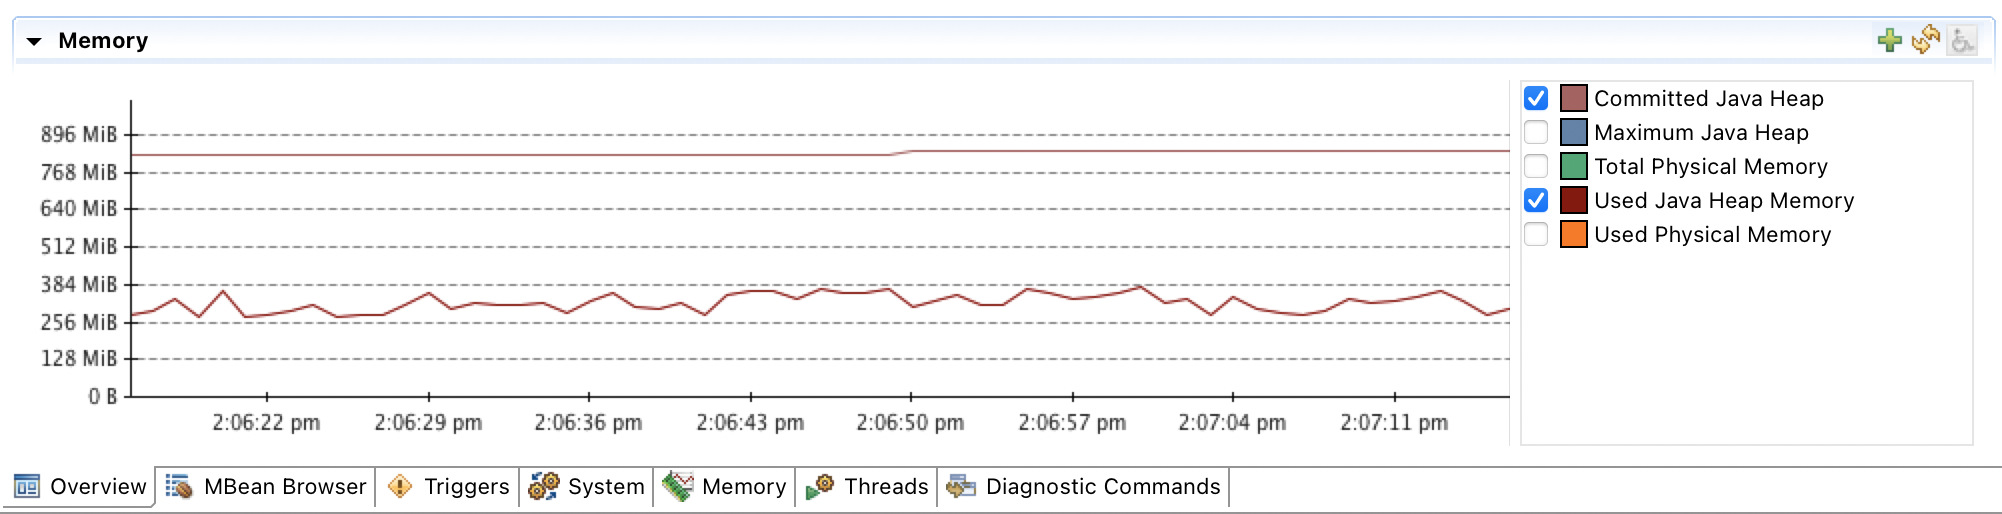
Running Java Mission Control (JMC) and connecting to the JVM shows that even though Xmx is specified to be 1G, the committed heap is much smaller.
The real heap size can also be confirmed by running a jcmd which shows
that ~900M is reserved.
$ jcmd 229 GC.heap_info
229:
 garbage-first heap   total 900096K, used 396562K [0x00000000c0000000, 0x0000000100000000)
  region size 1024K, 3 young (3072K), 1 survivors (1024K)
 Metaspace       used 7410K, committed 7744K, reserved 1056768K
  class space    used 764K, committed 960K, reserved 1048576K
While a smaller memory footprint might be beneficial in some cases, it can be a foot gun in others, for example, for an application running in a container or a VM, as the actual heap size is ergonomic and depends on the application load. And an application that runs successfully in a development environment might have vastly different memory requirements when it runs in production under heavy load. If the application runs successfully in a developer environment, it doesn’t mean that it won’t crash after five minutes in production, even though the memory configuration is the same.
Let’s attempt to make the heap size more predictable and ensure that the
heap size is preallocated at the start. One way to do so is to use Xms
(-XX:InitialHeapSize) flag. Starting the application with the initial
heap size of 1G immediately takes effect, which can be confirmed with
jcmd again.
$ java -Xmx1G -Xms1G ${JMX_OPTS[@]} -cp build/classes/java/main/ me.serce.LongRunningAlloc &
[1] 1812
$ jcmd 1812 GC.heap_info
1812:
 garbage-first heap   total 1048576K, used 437071K [0x00000000c0000000, 0x0000000100000000)
  region size 1024K, 1 young (1024K), 0 survivors (0K)
 Metaspace       used 4887K, committed 5056K, reserved 1056768K
  class space    used 547K, committed 640K, reserved 1048576K
As expected, jcmd shows 1G total heap size. However, checking top
shows that RES showing the memory used by the process is only 300M, not
the 1G specified.
$ top
 PID  USER      PR  NI    VIRT    RES    SHR S  %CPU  %MEM     TIME+ COMMAND
 3588 root      20   0 4278508 294192  26460 S  25.7   4.8   0:01.94 java
The effect here is very similar to the simple C example at the beginning
of the article. The memory pages were allocated, but they haven’t been
touched yet. It means that the actual memory usage might only be
discovered under load, not by running the application in standby mode.
Ideally, it’ll be done before the first request hits your application.
One way to ensure that the heap is memory allocated fully on startup is
to use -XX:+AlwaysPreTouch option, which ensures that all heap pages
reside in RAM when the application starts.
$ java -Xmx1G -Xms1G -XX:+AlwaysPreTouch -cp build/classes/java/main/ me.serce.LongRunningAlloc &
[1] 3616
$ top
 PID  USER      PR  NI    VIRT    RES    SHR S  %CPU  %MEM     TIME+  COMMAND
 3616 root      20   0 4278508   1.1g  25840 S  16.9  18.5   0:02.31  java
These options might not be the best defaults for desktop applications that must co-exist with other processes. However, when there are no other processes competing for allocated RAM in the server environments with fixed pre-allocated resources, it’s reasonable to ensure that the resources are eagerly allocated during the startup. Not only does this help to avoid the OOM crash when the load on the application increases, but also helps to avoid overhead from having to resize heap while serving user requests. Note, that even though a JVM starts using resources from the beginning, it doesn’t mean that it’ll keep using them, as depending on the GC, it might start un-committing memory.
Investigating OOM errors
Above, we discussed cases where an application might not use all available memory. Yet as we saw before, often the problem is that it doesn’t have enough heap space. When this happens, a gentle OutOfMemory error is thrown. The first step in resolving the issue is understanding what caused it and, in this case, figuring out what has occupied the heap.
Now, let’s start the app again and try to peak at what resides inside
the heap. One of the quickest ways to do this is to use jmap to get a
histogram of all objects in heap.
$ java -cp build/classes/java/main/ me.serce.LongRunningAlloc &
[1] 13
$ jmap -histo 13
 num     #instances         #bytes  class name (module)
-------------------------------------------------------
   1:          8148      137725784  [B ([email protected])
   2:           137        2717992  [C ([email protected])
   3:           470         536784  [I ([email protected])
   4:           135         270704  [S ([email protected])
   5:          7933         190392  java.lang.String ([email protected])

...

Total         25483      141949064
From the output above, we can see that byte arrays [B consume most of the heap. This
knowledge is a great clue, but in large applications, it’s often hard to
understand which code paths lead to the creation of most of these
arrays. Unless the histogram shows something obvious, a complete
snapshot of the heap memory can be helpful — a heap dump.
Collecting heap dumps
First, a heap dump needs to be collected. Let’s dump the memory of the
same app using jmap.
$ jmap -dump:live,format=b,file=heapdump.hprof 2130
Dumping heap to /proj/heapdump.hprof ...
Heap dump file created [140656507 bytes in 0.630 secs]
A heap dump is created on-demand, and now it can be analysed to understand a full path to the "offensive" code. However, most of the time, it’s useful to know the state of the heap right before the error, not at an arbitrary point in time. And the following startup options can help to catch a heap dump when an OOM exception occurs.
$ JAVA_OPTS=(
     -XX:+HeapDumpOnOutOfMemoryError
     -XX:HeapDumpPath=heapdump.hprof
     # optionally if OOMs are never expected
     -XX:+ExitOnOutOfMemoryError
  )
$ java "${JAVA_OPTS[@]}" -cp build/classes/java/main/ me.serce.OomAlloc
java.lang.OutOfMemoryError: Java heap space
Dumping heap to heapdump.hprof ...
Heap dump file created [269635799 bytes in 1.061 secs]
Terminating due to java.lang.OutOfMemoryError: Java heap space
$ ll -h heapdump.hprof
-rw------- 1 root root 258M Oct  2 02:14 heapdump.hprof
The options above are reasonable defaults for many server-side applications, but not all. In most cases, seeing an OOM is a strong signal that the application is in a terrible state, and letting it die quickly is the best thing to do. However, for some applications having a few OOMs every now and then could be expected and normal. For example, traditional thread-per-request applications could catch OOM errors if a particular request causes it, drop the request, and continue serving the next request. However, for most applications, letting it die and storing a heap dump for later analysis is a reasonable approach.
Now that a heap dump is captured, it’s time to analyse it to find the root cause of the issue.
Analysing heap dumps
The most common tools to analyse a heap dump are Eclipse MAT and IntelliJ.
Eclipse MAT
Eclipse MAT is an immensely powerful tool for exploring heap dumps. After a bit of practice, it can help to reveal even the trickiest issues. Once opened, Eclipse MAT suggests running a set of automatic reports that can quickly highlight the problem in most cases, for example, for simple issues like the one above.
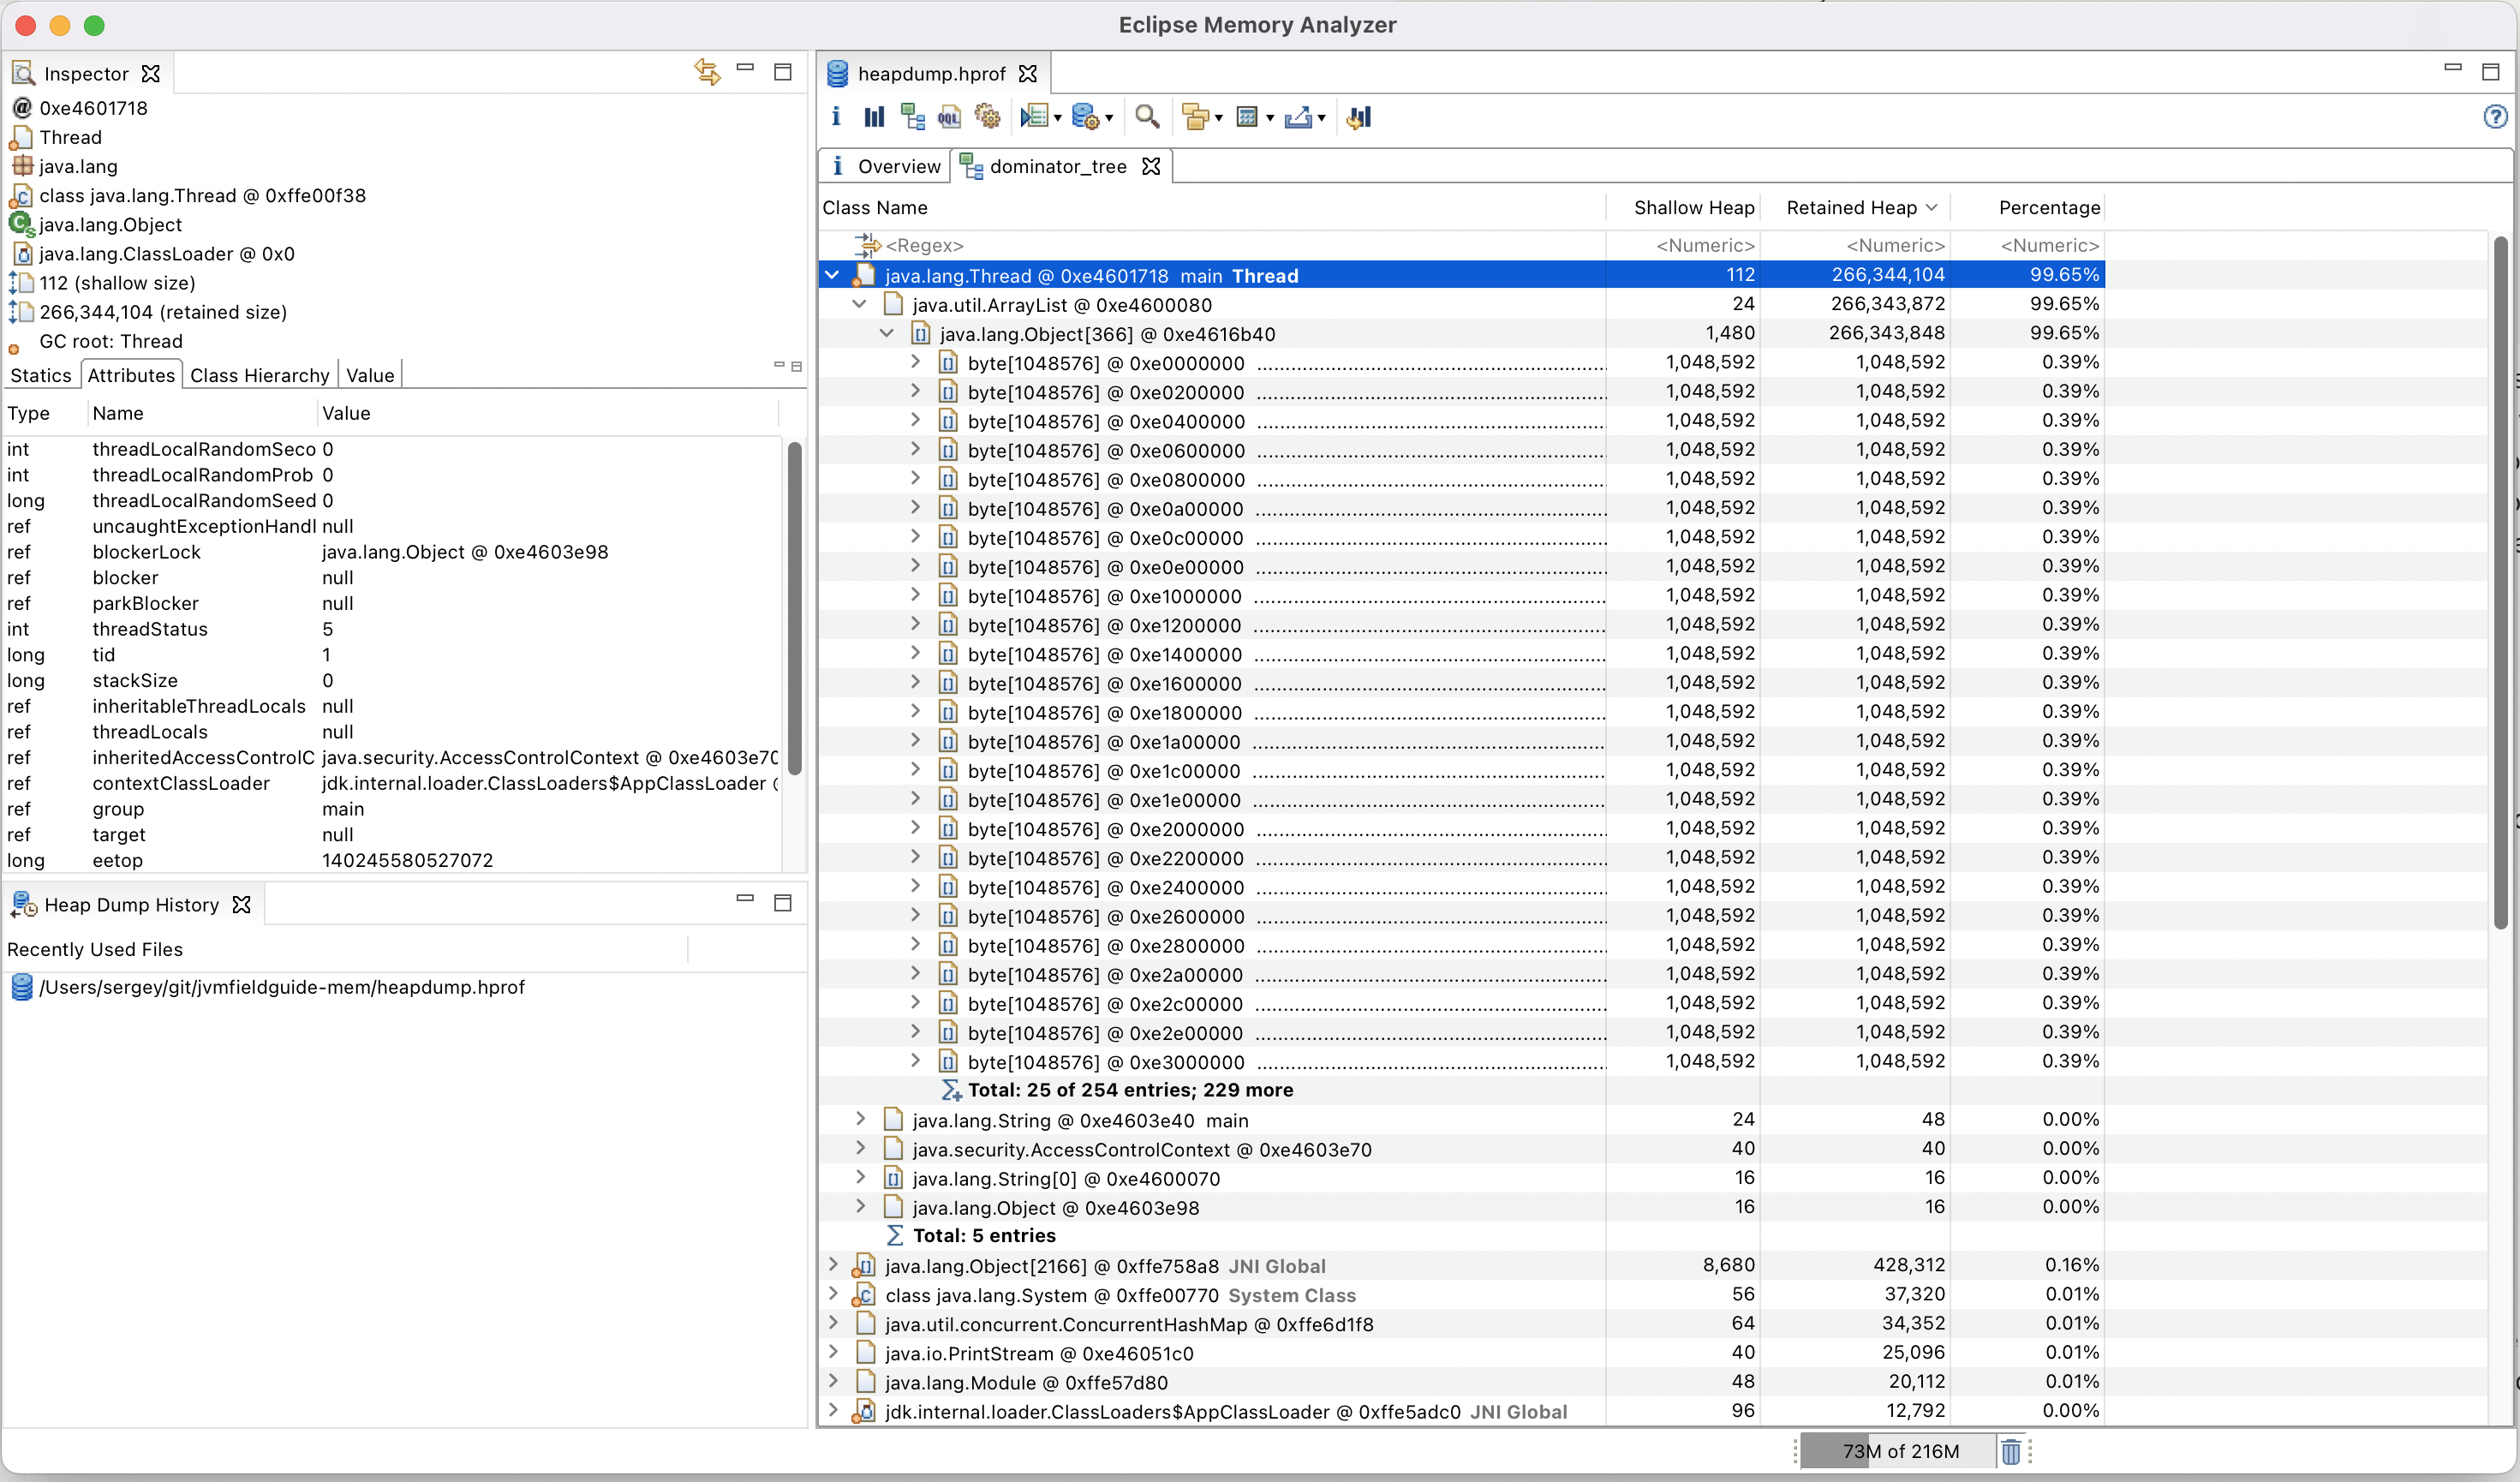
Opening the dump and navigating to the dominator highlights the array list containing references to all the allocated arrays. The amount of retained heap and the percentage it doesn’t leave room for doubt that it’s the source of memory leak. While this example is more of a toy problem, in reality, most OOM errors can be diagnosed relatively quickly as the problem usually jumps straight at you.
There are many resources online that describe heap dump analysis in great detail.
IntelliJ
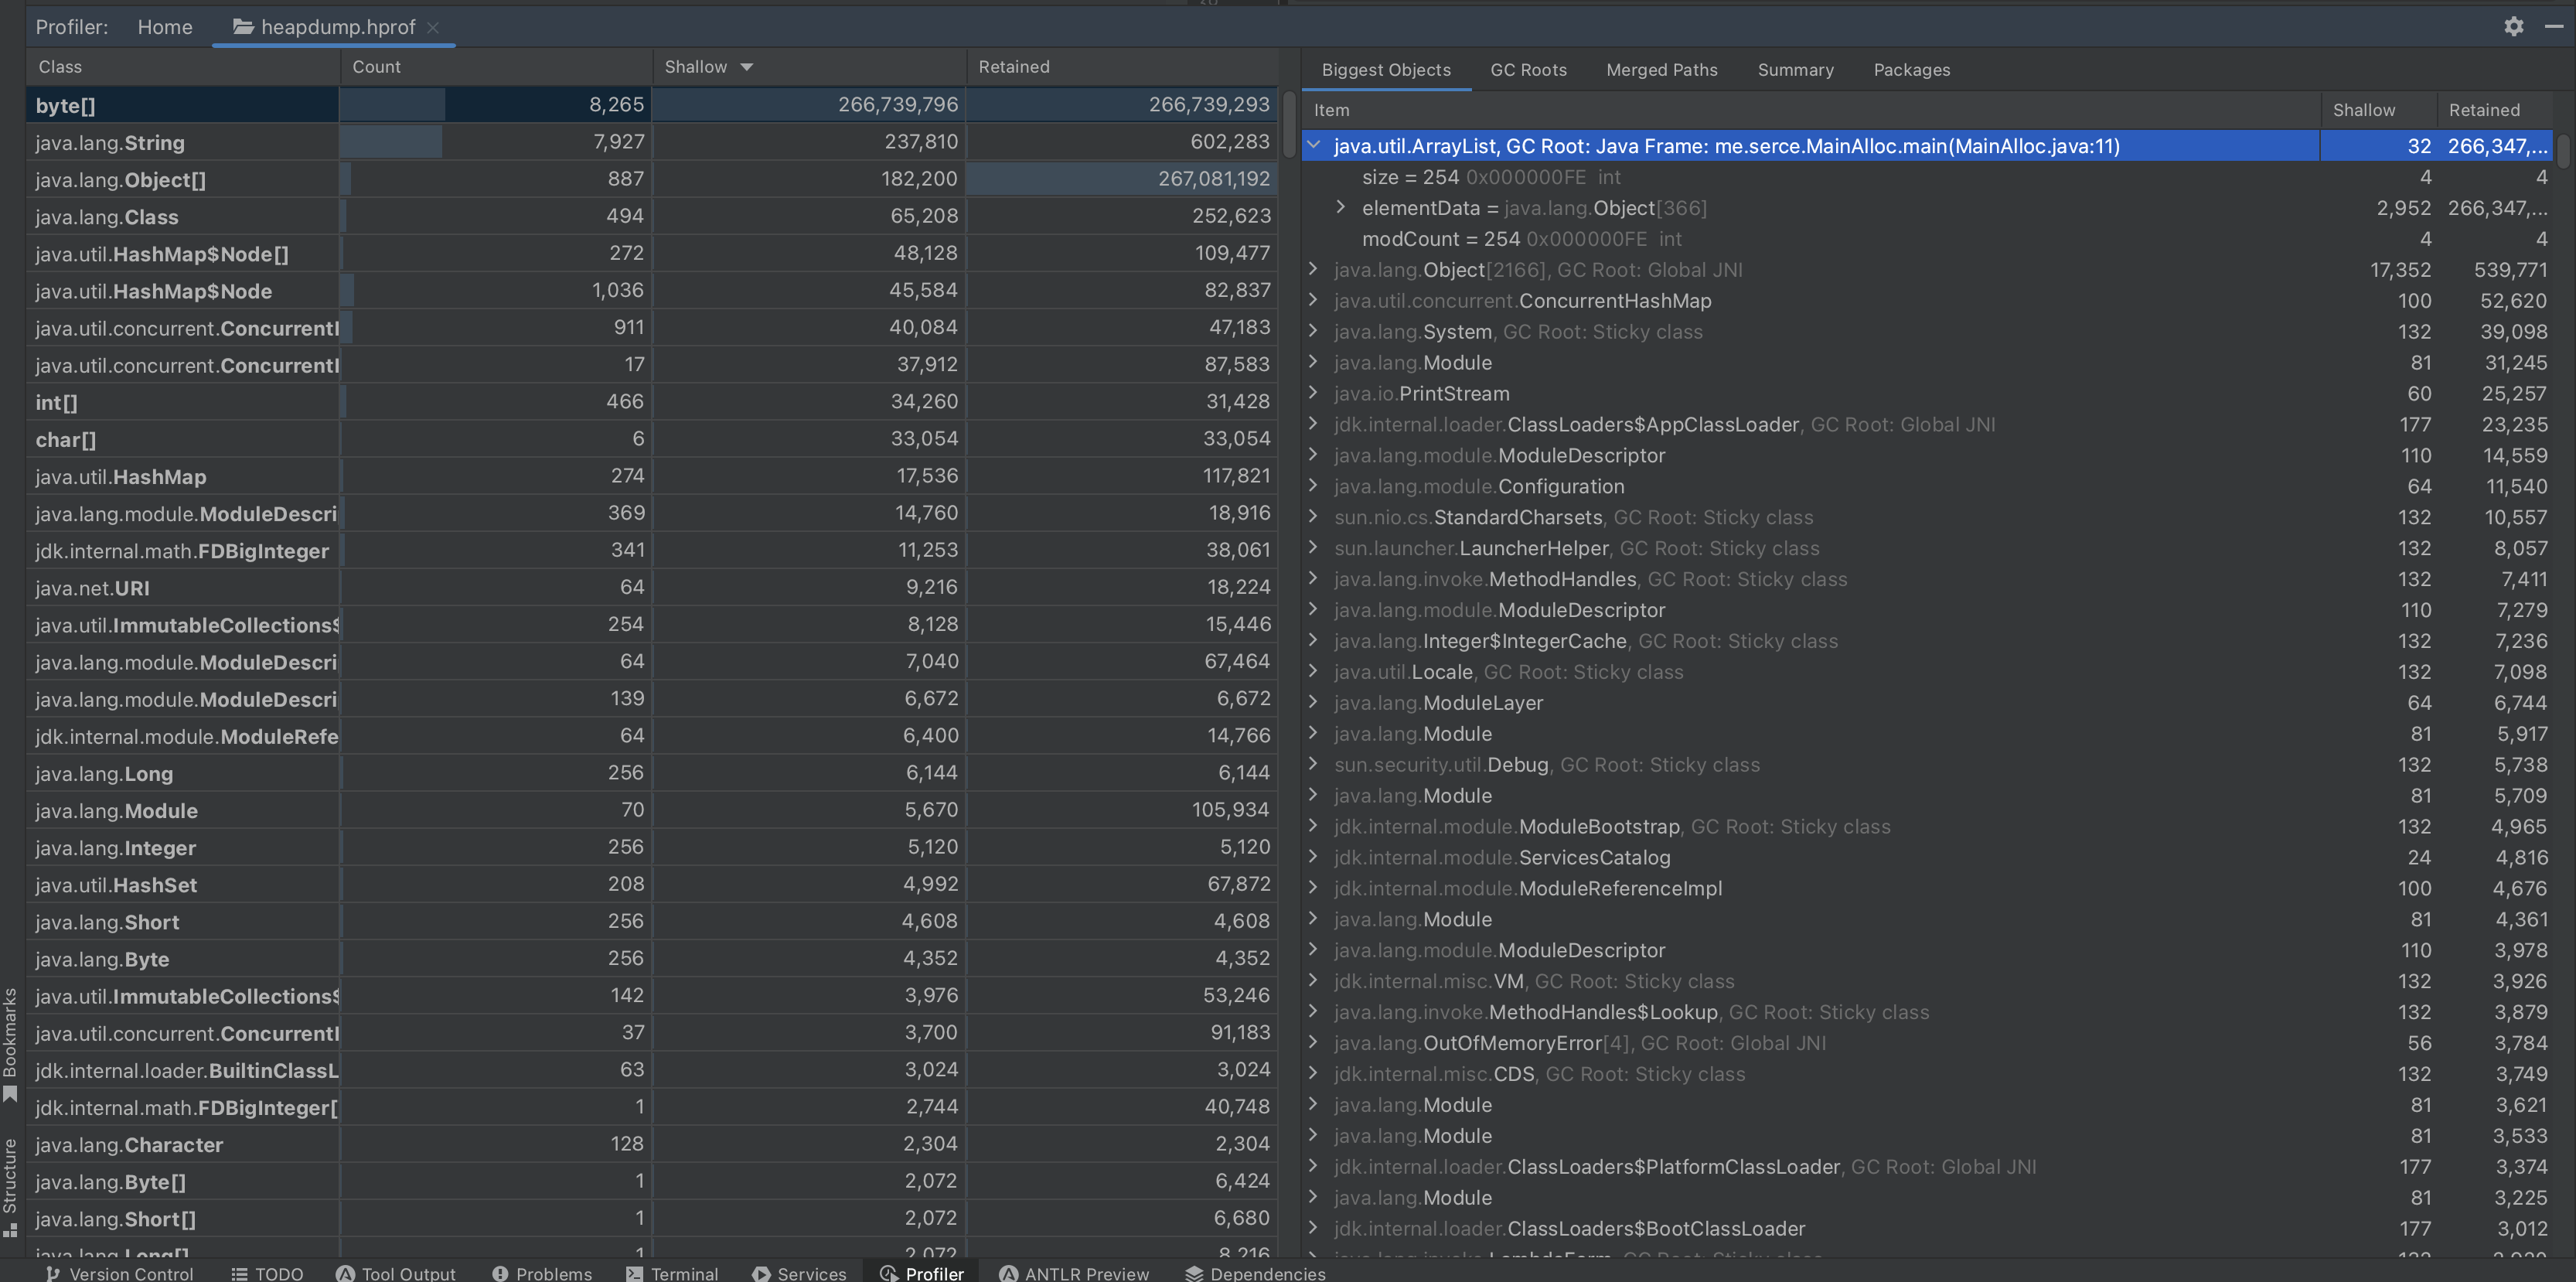
IntelliJ’s heap dump analyser is much newer. It’s not as powerful as Eclipse MAT. However, it’s a bit faster in my experience and can handle most cases relatively well.
Heap dumps are irreplaceable when finding the root causes of OOM errors. However, even when not failing, the application can behave suboptimally if the JVM cannot free memory well, so let’s discuss garbage collection.
Analyzing GC
There are a plethora of articles on the internet about all the garbage collectors available in the OpenJDK. However, the crucial thing to remember when making a GC choice is that it’s always a tradeoff between the pause time and the CPU/memory overhead of the collector.
And it’s important to call out that the GC choice affects many aspects of memory management. The first thing to note is that the additional memory needed to support the GC varies depending on the algorithm, as you’ll see from the native memory section below. As well as the way it’s reported in observability tools. For example, using ZGC commonly leads to reporting higher-than-real usage of RAM in RSS due to ZGC multi-mapping.
Choosing the right GC doesn’t mean it will all go according to plan. GC pauses can be detrimental to the performance of your application, and it’s essential to be able to monitor and investigate them.
Collecting GC logs
When an application encounters a long pause, Java engineers often think GC, and having GC logs to investigate is always a lifesaver. All diagnostic log options were standardized as a part of JEP-158 so that a single JVM option could configure them. I’m unaware of excuses for not having GC logging enabled on a production system. The line below is an example of such logging, which can be suitable for most conventional server-side JVM applications.
$ JAVA_OPTS=(
  -Xlog:safepoint*,gc*:file=gc/gc.log:time,level,tags:filecount=5,filesize=5000k
)
In the options above, five 5M files will be stored. The diagnostic logs collect both - GC logs and safepoint data, which will is discussed below.
Analyzing gc logs.
Various tools are available for analysing GC logs, e.g. GCGC, as well as online services like GCeasy. While GC logs do not contain any sensitive information, relying on online tools could be risky, looking at you Google Stadia. So, instead, all examples below are going to be illustrated with GCGC.
Let’s run the same example again, as it doesn’t do anything other than allocations, so it can almost immediately provide us with a good sample size of GC logs.
$ JAVA_OPTS=(...)
$ java "${JAVA_OPTS[@]}" -cp build/classes/java/main/ me.serce.LongRunningAlloc
After running for a couple of minutes the dataset is going to be produced and we can start exploring.
$ ll gc/ # shows the dataset GCGC
$ ./run.sh gcgc # launches GCGC
[I 11:10:01.714 NotebookApp] Serving notebooks from local directory: /root/GCGC/src
[I 11:10:01.714 NotebookApp] Jupyter Notebook 6.5.1 is running at:
[I 11:10:01.714 NotebookApp] http://localhost:8888/?token=1a1b7fab31e8b2e5bac40deb4740cdb45b7692ab92366e10
Opening GCGC, updating the paths and re-running the cells updates the report from which one can go step by step to explore all the information available from GC logs starting from the STW duration and all the way to things like pause frequency histograms.
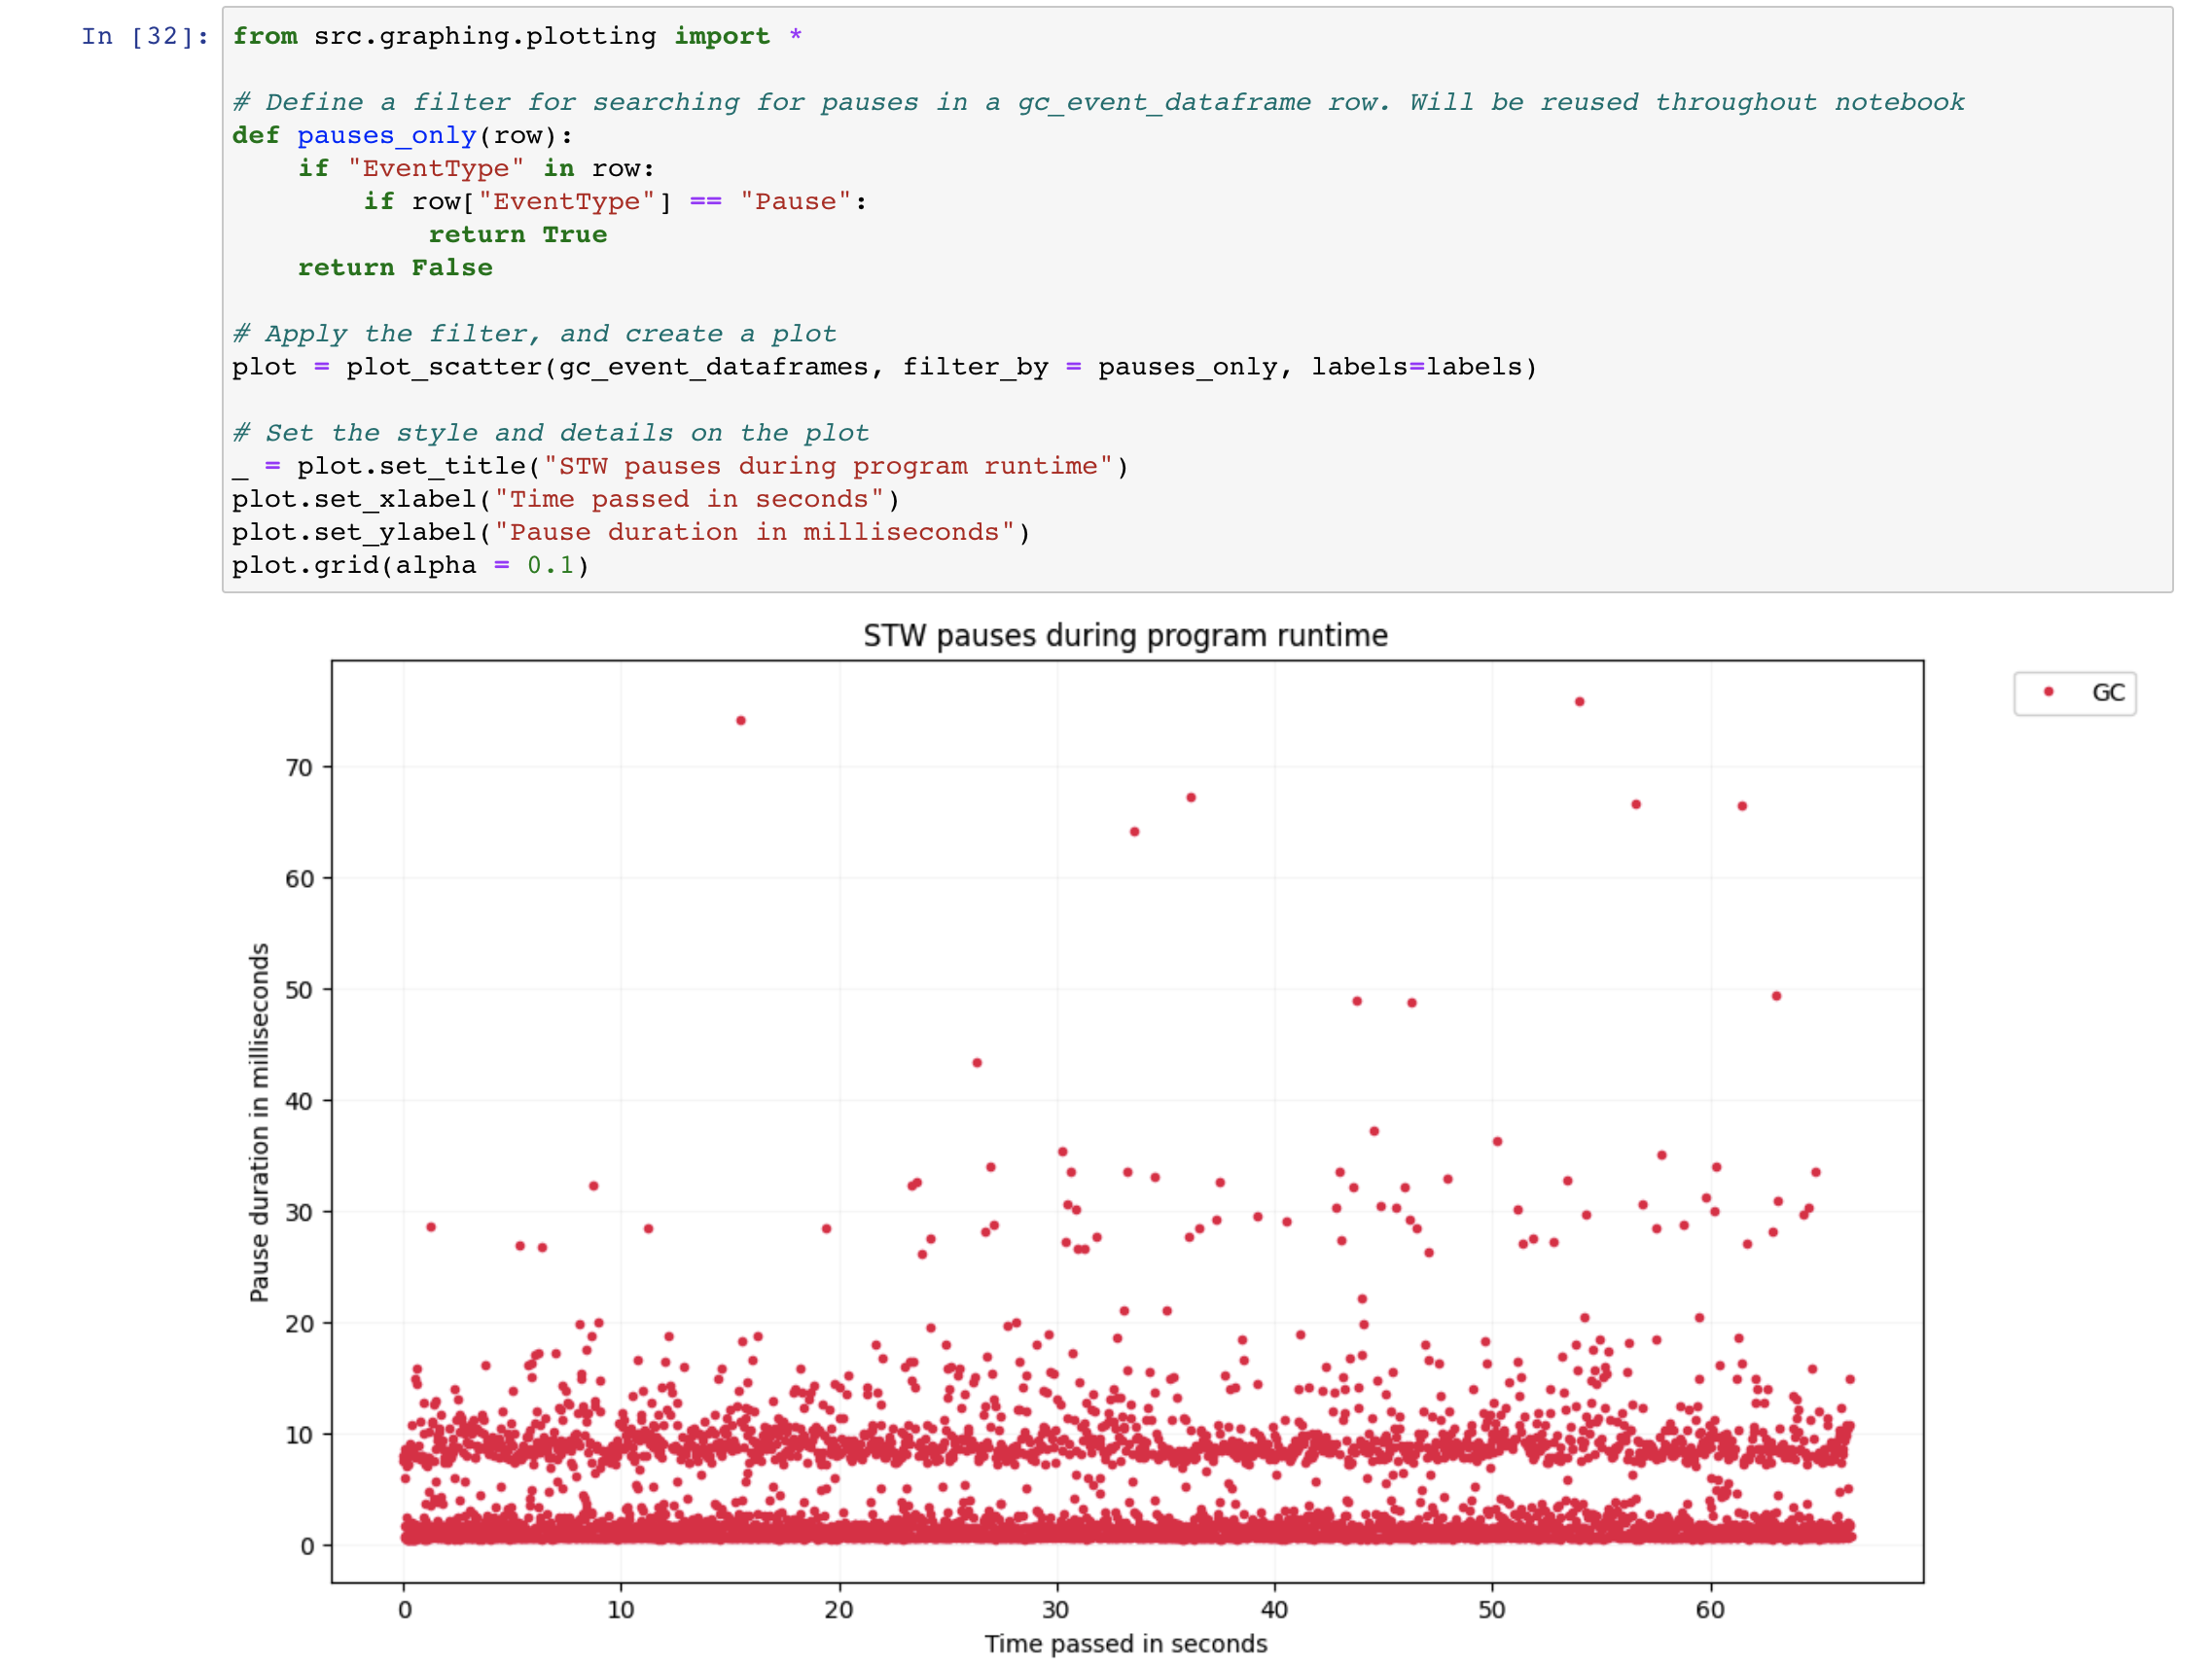
Analysing GC logs is crucial in understanding pauses when they don’t match the expectations. In this toy example, however, G1 GC being the default algorithm, behaves as expected, providing below 100ms pauses. Establishing expectations before starting the analysis is essential to the process, or otherwise, the graphs might not reveal much. When you don’t know the baseline, it’s hard to tell what behaviour is unexpected. In the Indirect Effects of Allocate Direct story, I described the debugging process of an issue when an application exhibited atypical behaviour.
Safepoints
I mentioned before that we included a line to collect safepoint data in the above JVM options. Safepoint data can often be overlooked when one analyses application pauses, but as silent killers, when their impact can be significant.
It’s relatively hard to come by an example of code where safepoint-related pauses are to blame in modern JVM. However, in some cases, they still might be the reason behind long pauses, like in the example below. To reveal safepoint pauses clearly, we’ve added a couple of flags that dump the list of threads waiting to reach a safepoint if the delay exceeds 100ms.
$ JAVA_OPTS=(
    -Xlog:safepoint*,gc*:file=gc/gc.log:time,level,tags:filecount=5,filesize=5000k
    -XX:+SafepointTimeout
    -XX:SafepointTimeoutDelay=100
)
$ java "${JAVA_OPTS[@]}" -Xmx2G -cp build/classes/java/main/ me.serce.LongRunningSafepointAlloc
After running the application for some time, you can start observing regular safepoint timeouts where the application is waiting for one specific thread – copying-thread to stop.
[73.509s][warning][safepoint] # SafepointSynchronize::begin: Timeout detected:
[73.511s][warning][safepoint] # SafepointSynchronize::begin: Timed out while spinning to reach a safepoint.
[73.512s][warning][safepoint] # SafepointSynchronize::begin: Threads which did not reach the safepoint:
[73.513s][warning][safepoint] # "copying-thread" #14 prio=5 os_prio=0 cpu=63730.82ms elapsed=73.02s tid=0x00007fc9783aeb30 nid=0x9cc runnable  [0x00007fc94d6ed000]
[73.514s][warning][safepoint]    java.lang.Thread.State: RUNNABLE
[73.515s][warning][safepoint]
[73.517s][warning][safepoint] # SafepointSynchronize::begin: (End of list)
If we look at the thread, we notice that it does array copying large arrays that can cause a long time-to-safepoint (TTSP). And looking at the relevant safepoint in GC logs reveals that even though, the GC operation itself was quick — only 3ms, reaching the safepoint took 100 times longer — 222ms.
[2022-10-29T01:43:07.870+0000][info ][safepoint ] Safepoint "G1Concurrent", Time since last: 26974800 ns, Reaching safepoint: 222321200 ns, At safepoint: 2585800 ns, Total: 224907000 ns
In the GC logs above, we can see a line that indicates that even though the time spent at a safepoint wasn’t large, the time to reach the safe point was very long.
Heap Allocation profiling
Choosing the right GC can help optimise how the workload can be dealt with. Yet, sometimes the only way to achieve the desired result is to reduce the workload, specifically the number of allocations. And the first step in doing so is usually to understand where those allocations happen.
Let’s start the allocation example again as a now familiar example.
$ java -cp build/classes/java/main/ me.serce.LongRunningAlloc &
[1] 301
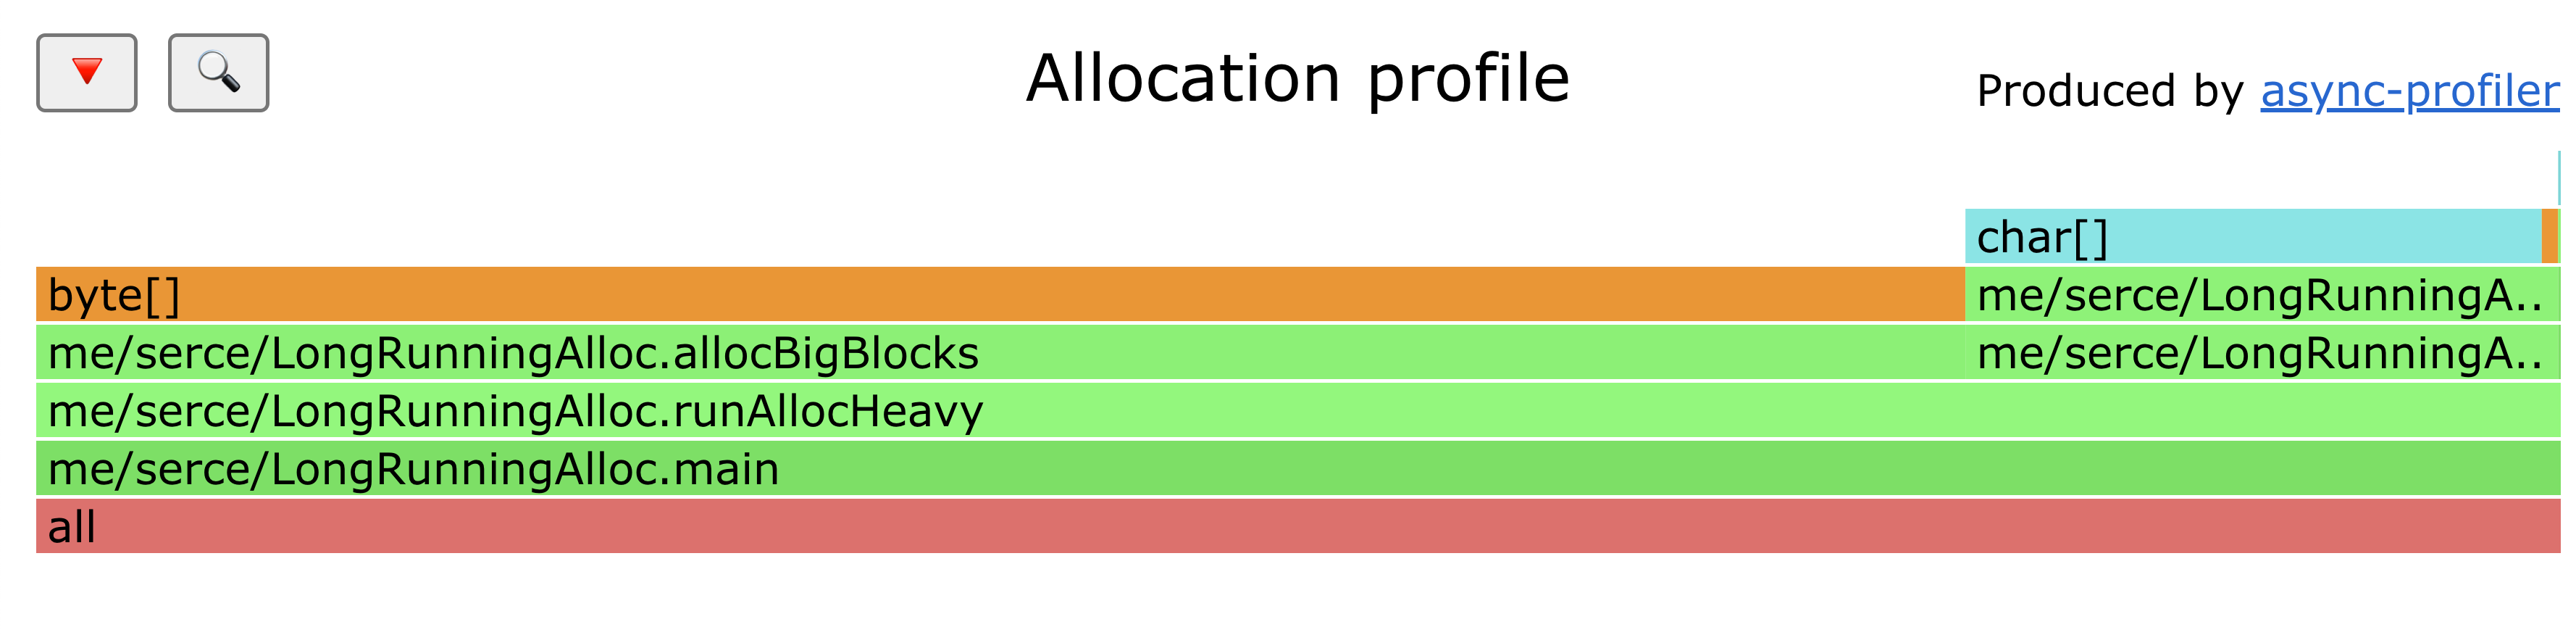
One of the most effective tools to profile the application memory allocations to understand where most of the objects are allocated from is async-profiler which is conveniently preinstalled inside the testing container.
$ profiler.sh 301 -d 30 -e alloc -f flamegraph.html
Profiling started
Profiling for 30 seconds
Now, in the graph above we can clearly see that the number of allocations is higher in the method. The blue allocations are allocation inside Thread Local Allocation Buffers (TLAB), while the orange ones are the allocations inside heap.
Now that we know where allocations occur, the next step is eliminating them. In many cases, it might be possible to rewrite code in a way that doesn’t require as many allocations at all. However, in some cases, it’s inevitable that they’ll be needed, in which case the main technique to eliminate them is to use a pool of pre-allocated objects.
Offheap memory
Now that the heap memory region is sorted, it’s time to look at what lives outside the heap. As we’ve seen from examples before, a full-blown crash is one of the most common symptoms of a memory leak. In this case, taking an easy-to-analyse heap dump is not an option. However, JVM provides a way to profile native memory usage to understand which memory segment is at fault. We can use a now familiar example to get the first read of native memory usage.
$ JAVA_OPTS+=(
    "-XX:NativeMemoryTracking=summary"
)
$ java "${JAVA_OPTS[@]}" -cp build/classes/java/main/ me.serce.LongRunningAlloc &
[1] 133
Using the jcmd command, we can see the memory consumption where heap
space takes 524 MB. The header shows that a total of 1.9G of memory is
reserved, which should fit within our container constraints. And only
620 Mb of it is actually committed.
$ jcmd 133 VM.native_memory
133:

Native Memory Tracking:

(Omitting categories weighting less than 1KB)
Total: reserved=1945369KB, committed=618021KB
-                 Java Heap (reserved=524288KB, committed=524288KB)
                            (mmap: reserved=524288KB, committed=524288KB)
...
Following the header, each section describes a different native memory area. Let’s go through the most impactful areas.
Class space
The next area here is the class space. We can see an impressive 1G reserved.
...

-                     Class (reserved=1048656KB, committed=208KB)
                            (classes #486)
                            (  instance classes #402, array classes #84)
                            (malloc=80KB #578)
                            (mmap: reserved=1048576KB, committed=128KB)
                            (  Metadata:   )
                            (    reserved=8192KB, committed=192KB)
                            (    used=78KB)
                            (    waste=114KB =59.48%)
                            (  Class space:)
                            (    reserved=1048576KB, committed=128KB)
                            (    used=3KB)
                            (    waste=125KB =97.37%)
...
Many popular Java frameworks tend to generate a large number of classes dynamically. Generating a new class can be expensive, so frameworks often generate numerous classes and then try to cache them all. Let’s try to take this practice to the extreme and run an example that endlessly generates new proxy classes and stores them in a field to prevent garbage collection.
$ java "${JAVA_OPTS[@]}" -cp build/classes/java/main/ me.serce.ClassSpaceAlloc  &
[1] 3384
$ watch -n 0.1 'jcmd 3384 VM.native_memory | grep -A 12 "Class ("' # to watch the space grow
After observing the application running for a while consuming the class space, we’ll see it crashing.
$ dmesg | tail -n 2
[ 2467.597033] Memory cgroup out of memory: Killed process 4760 (java) total-vm:5262204kB, anon-rss:2053804kB, file-rss:0kB, shmem-rss:0kB, UID:0 pgtables:4428kB oom_score_adj:0
[ 2467.727842] oom_reaper: reaped process 4760 (java), now anon-rss:0kB, file-rss:0kB, shmem-rss:0kB
There is a way to restrict the memory consumption of the class pace. Let’s set an explicit metaspace limit of 256M restart the process.
$ JAVA_OPTS+=(-XX:MaxMetaspaceSize=256m)
$ java "${JAVA_OPTS[@]}" -cp build/classes/java/main/ me.serce.ClassSpaceAlloc
java.lang.OutOfMemoryError: Metaspace
Exception in thread "main" java.lang.OutOfMemoryError: Metaspace
...
Now, we can see a friendlier java error instead that’s accompanied by a nice stack trace which tells us exactly where the error occurred, hinting at the code at fault.
Threads
-                    Thread (reserved=27765KB, committed=1029KB)
                            (thread #27)
                            (stack: reserved=27696KB, committed=960KB)
                            (malloc=39KB #166)
                            (arena=30KB #52)
By default, each stack requires 1M of memory. Generally, an -Xss
option defining it’s stack size to a lower value, e.g. 256k can be a
small win for applications with relatively small stacks and a large
number of threads.
That’s unless you work on an unfortunate application with stack traces that are higher than Empire State Building, in which case this "lifehack" is probably not for you.
Code Cache
-                      Code (reserved=247722KB, committed=7582KB)
                            (malloc=34KB #594)
                            (mmap: reserved=247688KB, committed=7548KB)
The code produced by Just-In-Time (JIT) compiler needs to be stored somewhere, and Code Cache is the place. Usually, the area being relatively small isn’t going to cause major issues. At times, however, you might want to either increase with the help of -XX:ReservedCodeCacheSize= it if it’s full, or decrease the limit if your application is running in a highly memory-constrained environment.
GC
-                        GC (reserved=70491KB, committed=70491KB)
                            (malloc=18131KB #2749)
                            (mmap: reserved=52360KB, committed=52360KB)
Choosing a GC with a smaller footprint, e.g. SerialGC, can help to reduce memory consumption at the significant expense of the overall performance. As an exercise, start the application with SerialGC, ParallelGC, and G1GC collectors, and compare the output.
Other
Other, despite having a boring and undescriptive name, is one of the most interesting sections of NMT because it includes the native memory allocated by byte buffers which are commonly used by a huge variety of network libraries.
$ JAVA_OPTS+=(
    "-XX:NativeMemoryTracking=summary"
)
$ java "${JAVA_OPTS[@]}" -cp build/classes/java/main/ me.serce.InternalDirectMemory &
[1] 133
$ watch -n 1 'jcmd 133 VM.native_memory  | grep -A 2 Other'
By running the code above, we can see Other slowly growing by approximately 1Mb every second, which directly matches to direct memory that we allocate.
-                     Other (reserved=32425KB, committed=32425KB)
                            (malloc=32425KB #32425)
And if you let it run for long enough, you’ll be able to see the out of memory error that saves the process from being killed by the oom killer.
java.lang.OutOfMemoryError: Cannot reserve 1024 bytes of direct buffer memory (allocated: 536870912, limit: 536870912)
        at java.base/java.nio.Bits.reserveMemory(Bits.java:178)
        at java.base/java.nio.DirectByteBuffer.<init>(DirectByteBuffer.java:121)
        at java.base/java.nio.ByteBuffer.allocateDirect(ByteBuffer.java:332)
        at me.serce.InternalDirectMemory.main(InternalDirectMemory.java:12)
The number is the same number that we’ve seen before - 512Mb as the
direct buffer memory limit is the same limit as the one set by
MaxHeapSize. The direct byte buffer memory limit can also be set
directly with MaxDirectMemorySize.
There are many more items in NMT, e.g. the information about NMT itself, the impact of class data sharing, etc. The issues with other monitored areas are much less common, in my experience. However, it’s important to know that they exist and can impact your Java application memory footprint, especially if it runs in a highly constrained environment.
JNI
Despite having Native in it's name, not all native allocations can be tracked with NMT. Specifically, NMT doesn’t report the allocations made by libraries linked through Java Native Interface (JNI). Let’s consider the below example that invokes two native methods.
public class NativeLib {
    static {
        System.load("/root/proj/src/main/java/me/serce/nativelib/libexnativee.so");
    }

    public static void main(String[] args) throws Exception {
        while (true) {
            goodNative(10 * 1024);
            badNative(10 * 1024);
            Thread.sleep(1);
        }
    }

    private static native void goodNative(int size);
    private static native void badNative(int size);
}
If we run the example above, and start monitoring memory usage with
htop, we’ll see that it’s leaking memory at the rate of around 10M per
second.
$ java -cp build/classes/java/main/ me.serce.nativelib.NativeLib &
$ htop
Ignoring the descriptive names, it’s hard to tell which method leaks memory without a way to profile native allocations.
Native memory allocation profiling
Once it’s been settled that the heap region isn’t growing, but the off-heap region is, one can try to evaluate where the leak occurs. One way to do this is to use NMT diff.
$ jcmd 123 VM.native_memory baseline
# a bit later
$ jcmd 123 VM.native_memory summary.diff
NMT isn’t able to tell us the exact source of memory leak, but it can often help narrow down it significantly or give various clues. And if the diff isn’t revealing the leak, then as mentioned above, chances are it’s due to a native memory allocation call from JNI.
Even if NMT reveals the issue, it won’t reveal the exact location in the code that causes the leak. Luckily, tools like async-profiler allow for looking under the cover to see where allocations actually occur by tracing each malloc call.
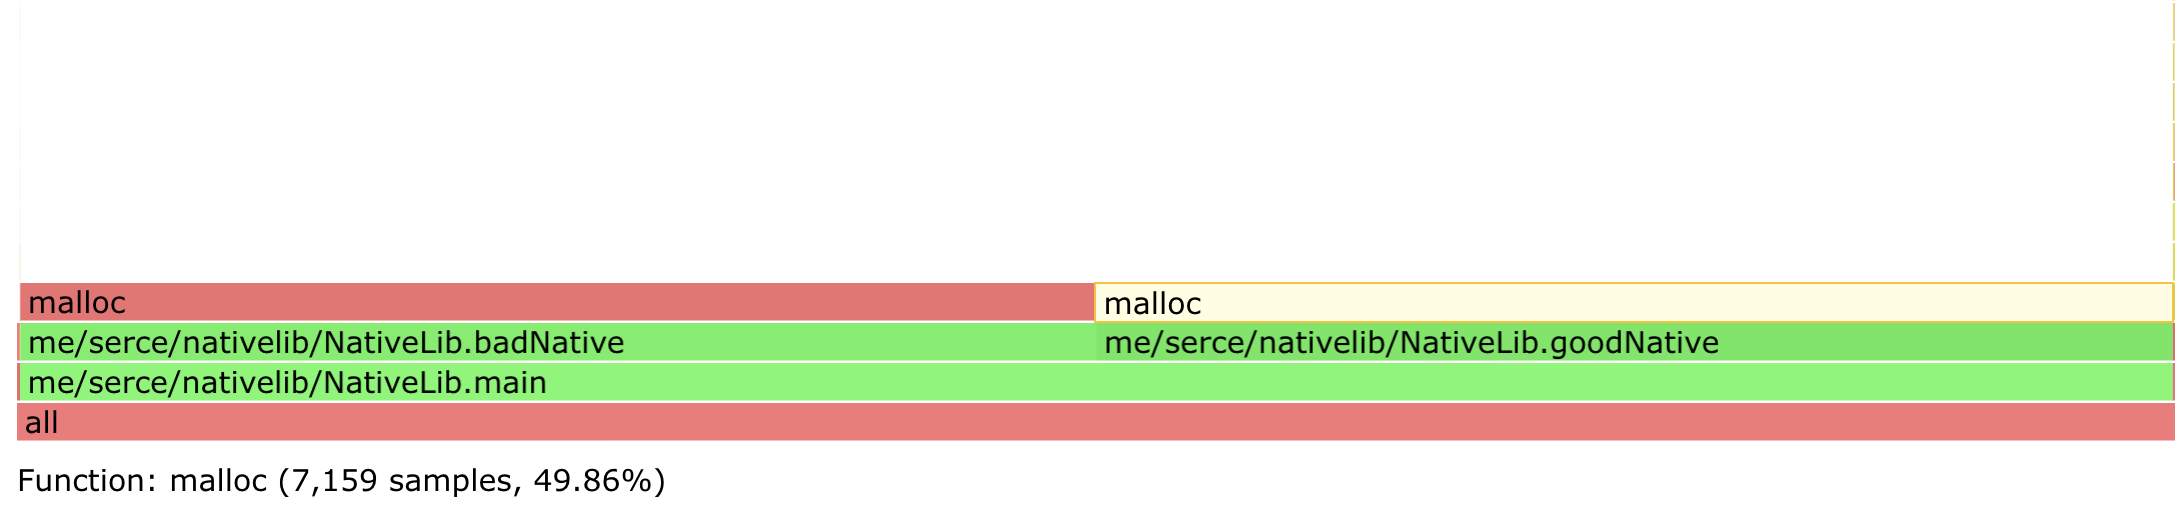
To see it in action, let’s run the same allocator from the JNI example and see how async profiler reveals the exact location of malloc.
$ java -cp build/classes/java/main/ me.serce.nativelib.NativeLib &
[1] 27
$ profiler.sh 27 -d 10 -e malloc -f flamegraph_malloc.html
Done
$ profiler.sh 27 -d 10 -e free -f flamegraph_free.html
Done
Comparing the two flame graphs quickly answers which method is freeing memory, and which is not.
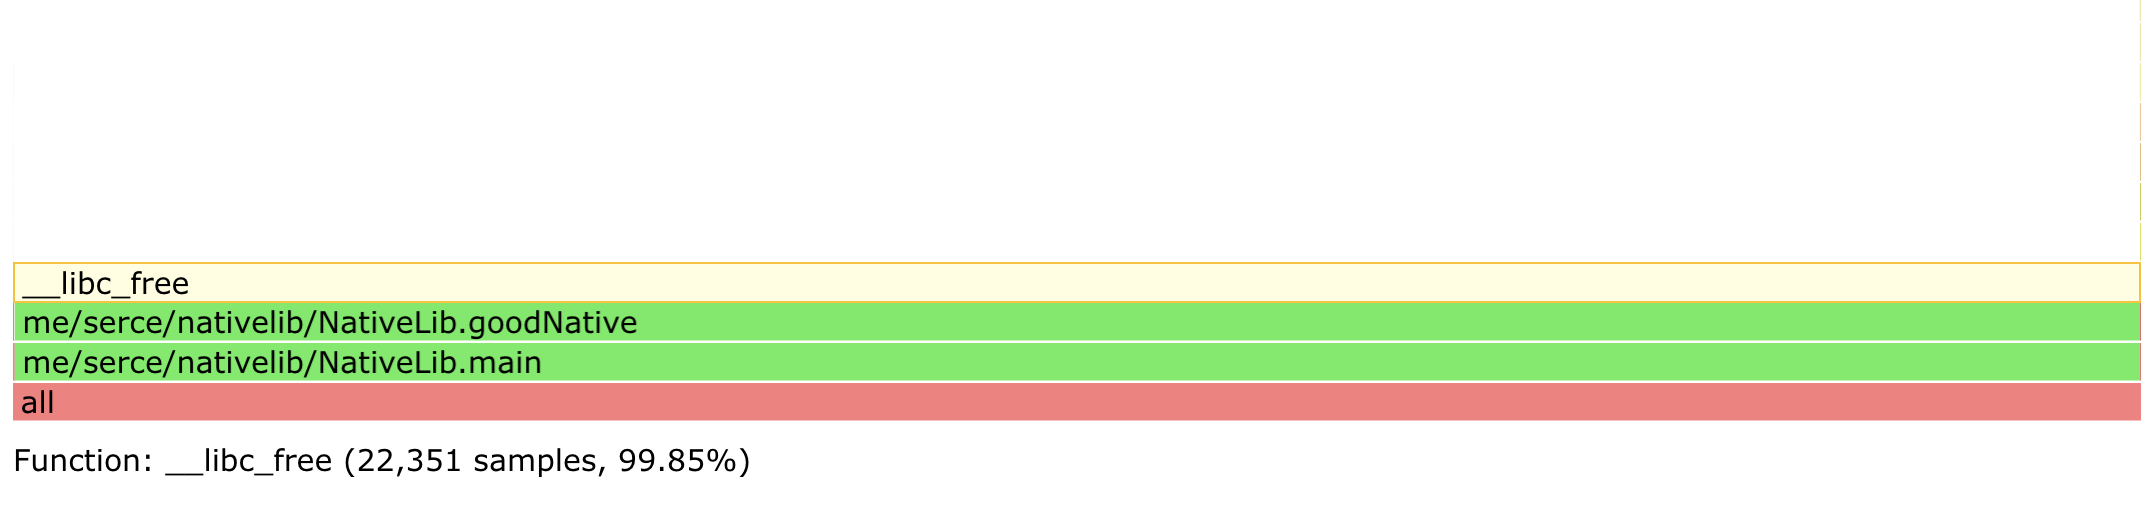
The example and the technique above is pretty simple, but the technique scales pretty well even to very complex cases. If a portion of a code is allocates memory like a memory leak, and doesn’t free memory like a memory leak, it’s probably a memory leak.
If you’ve encountered a case needing to step the game up, the nativemem profiling mode in async profile can be useful. The major caveat is that it was only available in a separate branch at the moment of writing this article. However, it might make it to the main branch by the time you’re reading this.
Going even further into the weeds, you can try the technique of using jemalloc as a replacement allocator for the JVM. While exciting, moving too far in this direction, however, would be way beyond the scope of a simple field guide.
Conclusion
Memory is a critical resource, and mismanaged memory is one of the most common sources of various issues, crashes, and problems. Understanding how JVM manages memory and what investigation tools exist and are readily available can help a great deal with running and maintaining JVM-based applications.
This article is by no means comprehensive. It’s only a brief field guide. Nonetheless, I hope it might have helped you understand the typical memory issues you might face in the JVM world. And if you think I’ve missed some neat techniques that have helped to deal with the JVM memory quirks in the past, let me know, and I’ll include this in the field guide.
Thank you to
- James Judd and Michael Theos for reviewing the article.
- You for reading the article.
References
- JEP 158: Unified JVM Logging
- JVM parts (mostly shown by Native Memory Tracking)
- Memory footprint of a Java process by Andrei Pangin
- Compressed Oops
- Heap Uncommit
- Off-Heap memory reconnaissance
- NMT diff by Thomas Stuefe
Discuss on
Subscribe
I'll be sending an email every time I publish a new post.
Or, subscribe with RSS.